

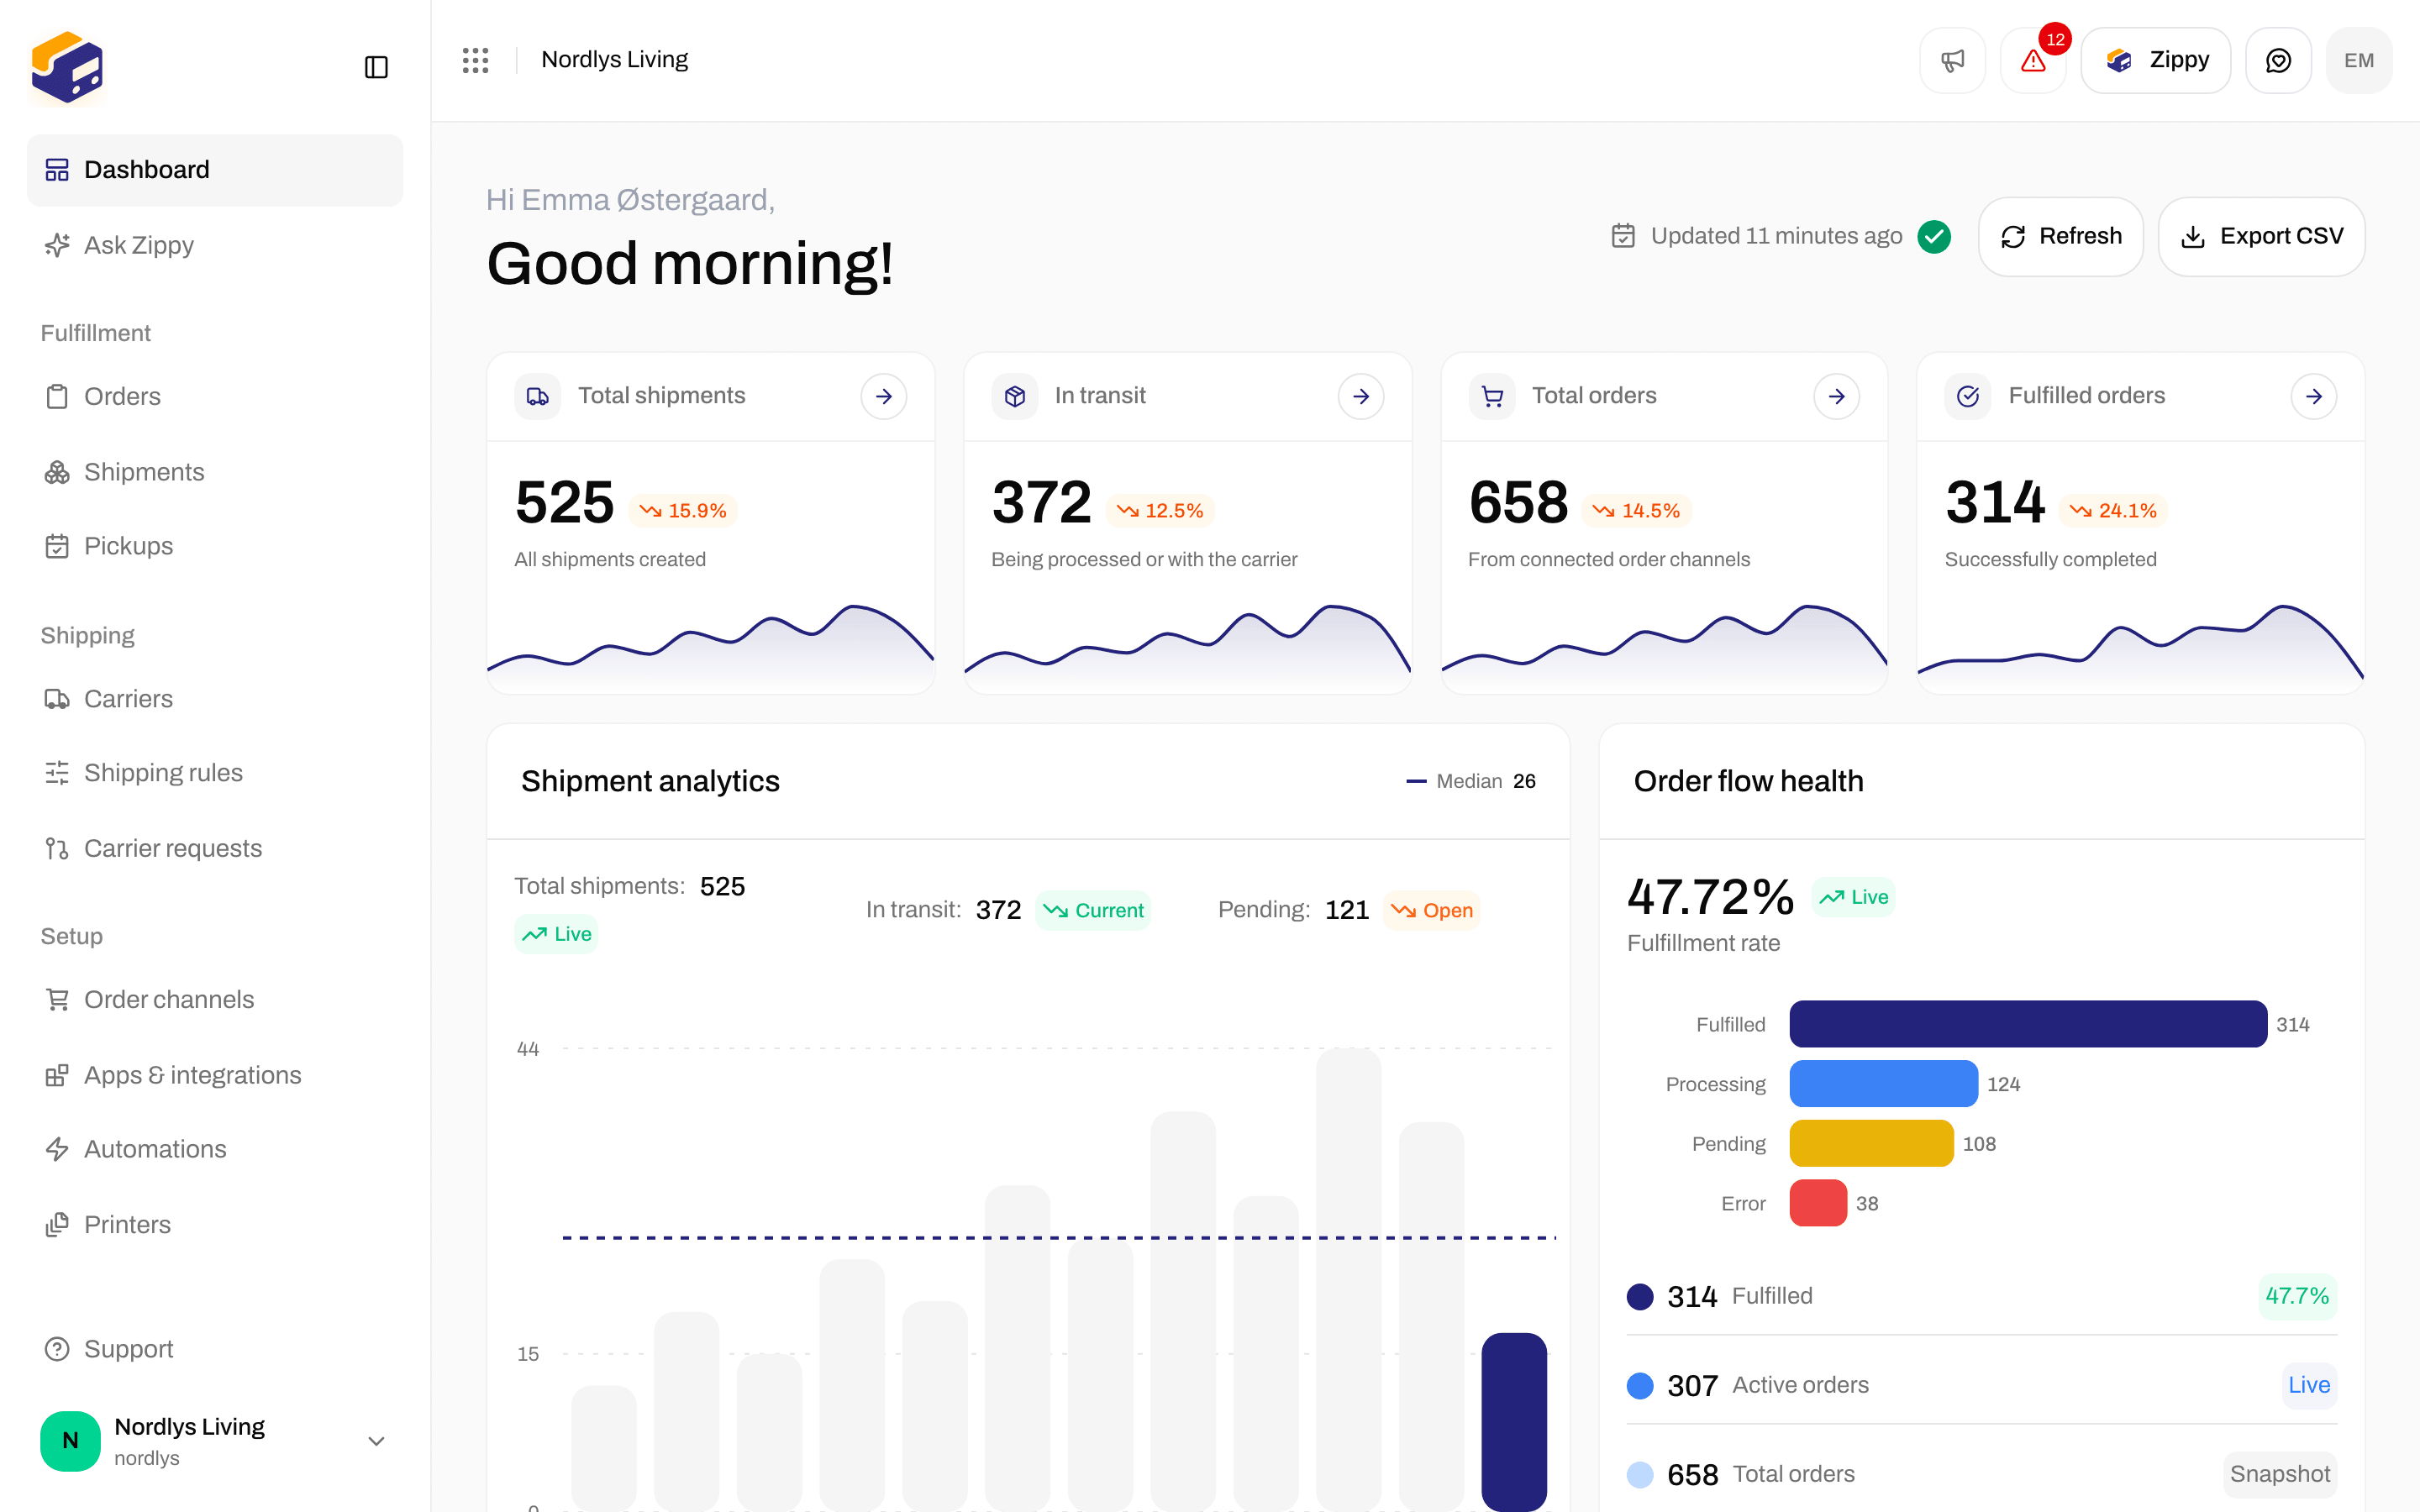
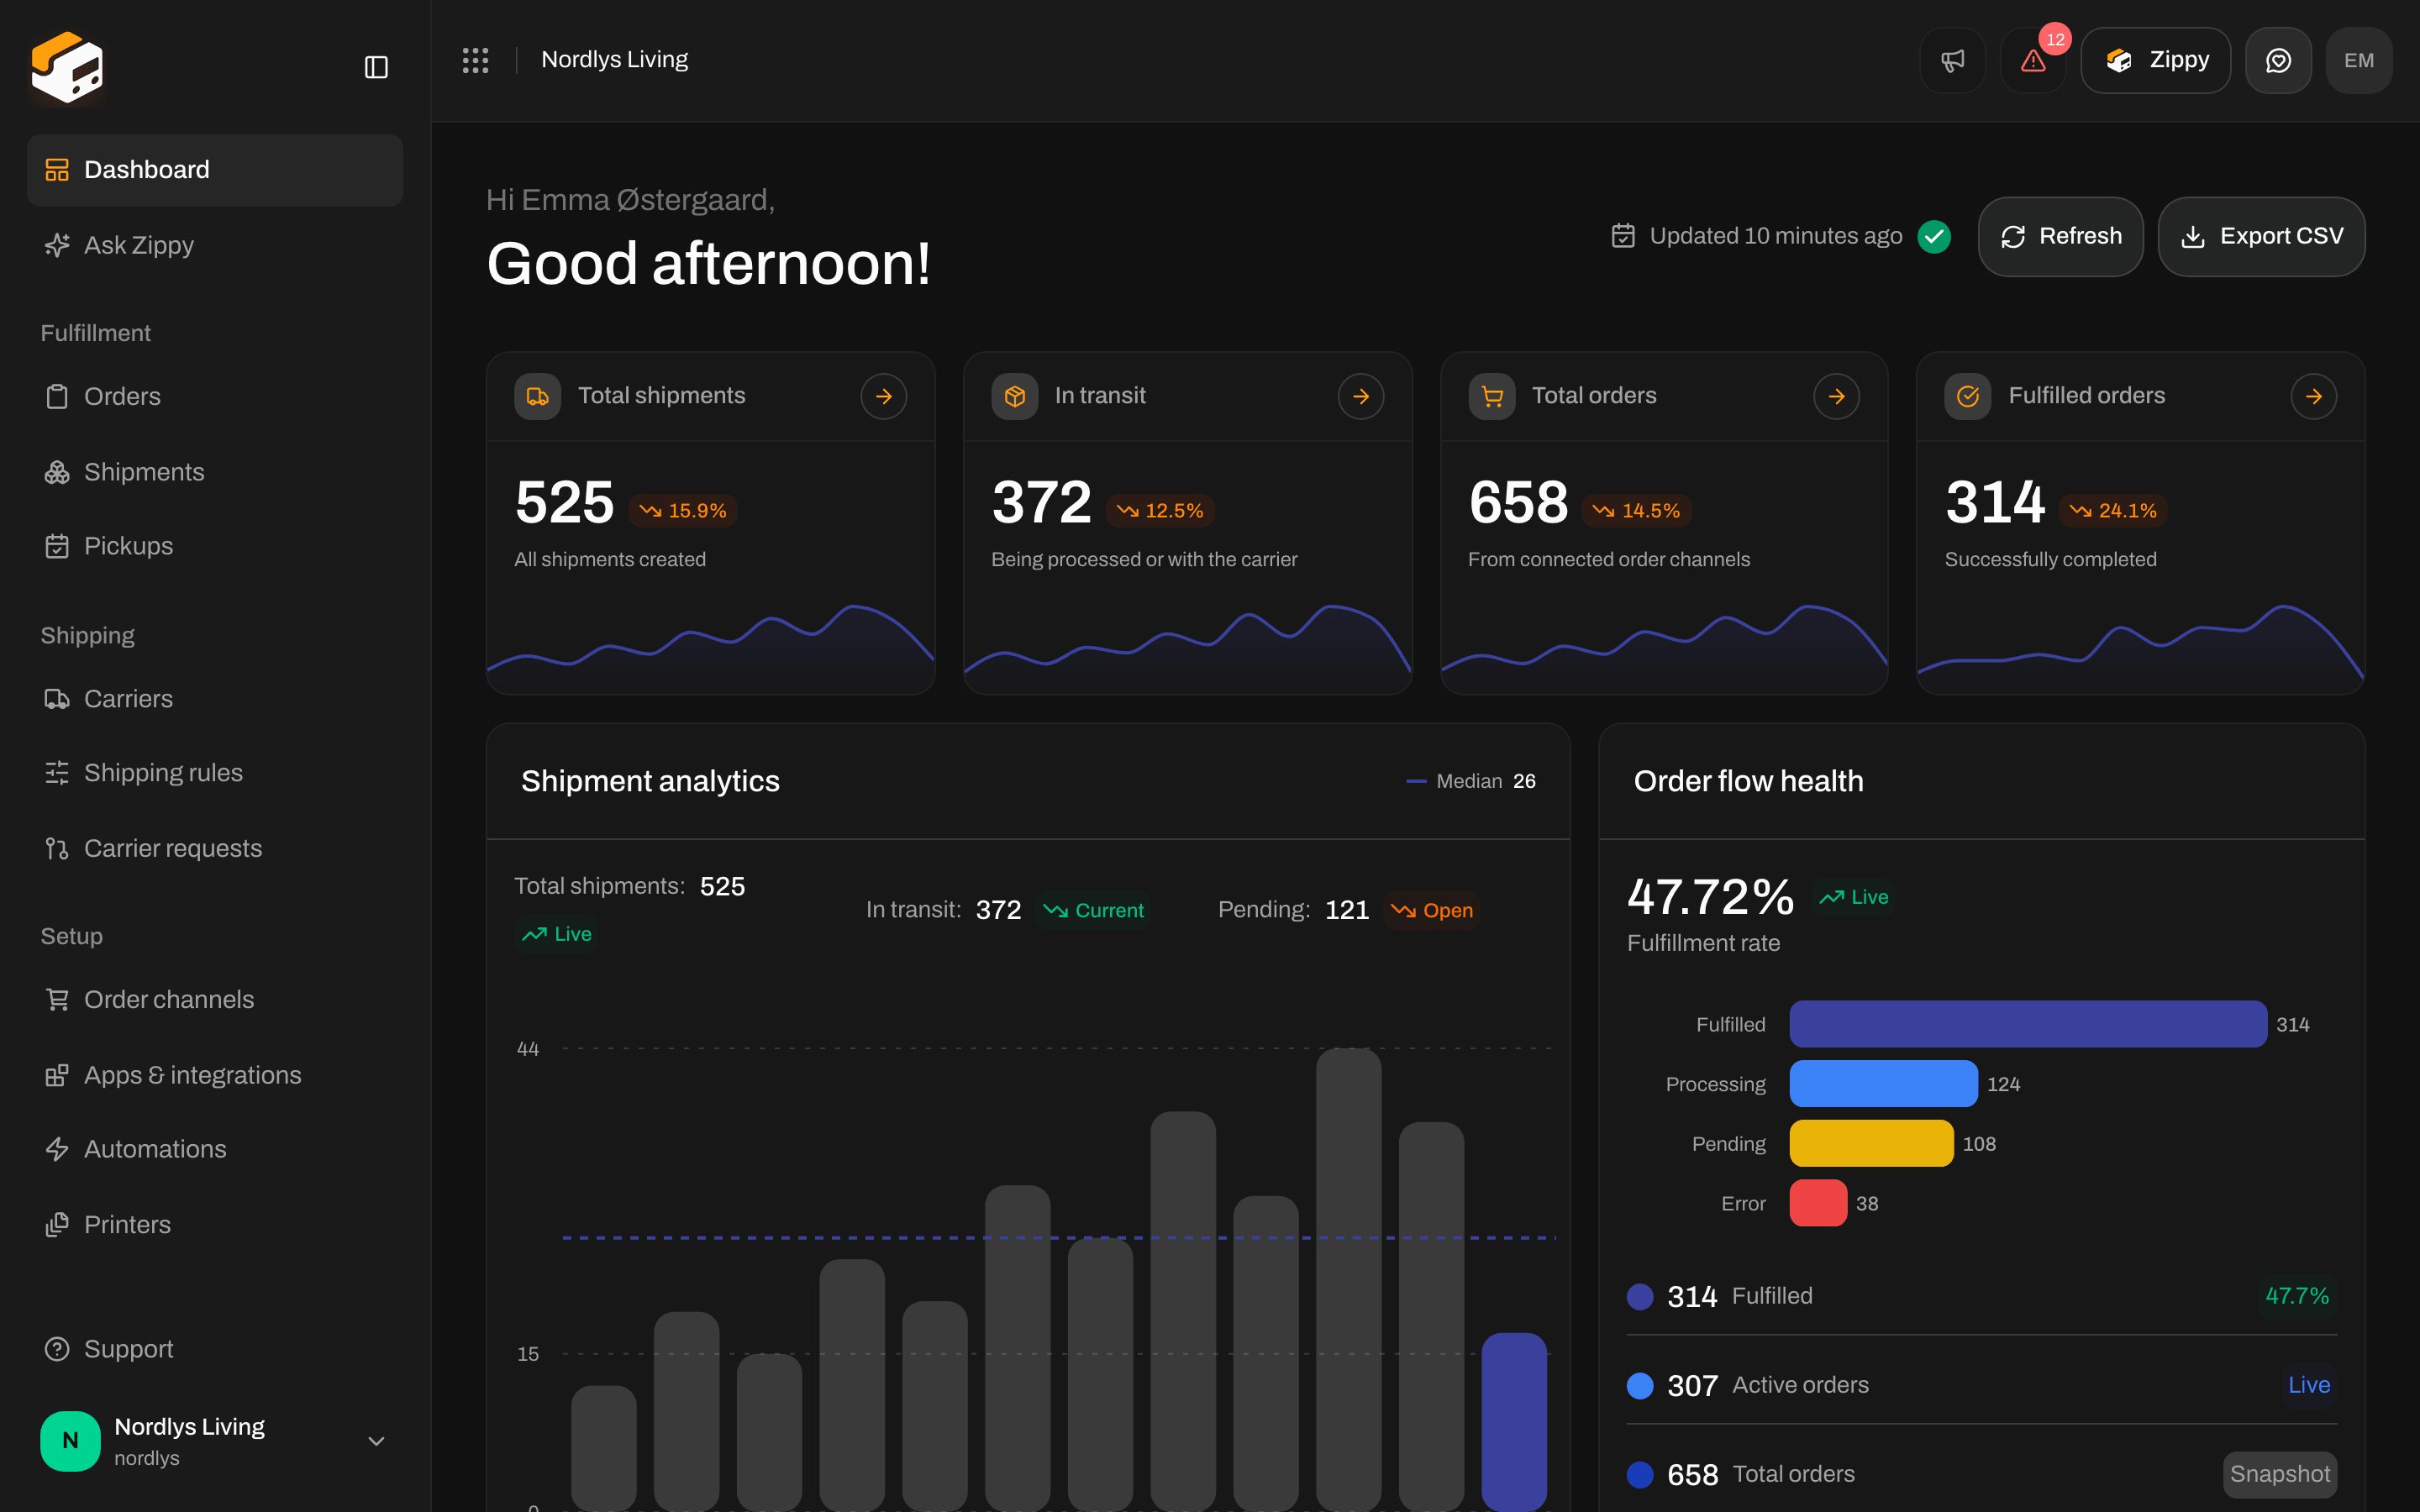
Dashboard when you sign in: greeting, Refresh and Export CSV, four key numbers, Shipment analytics and Order flow health
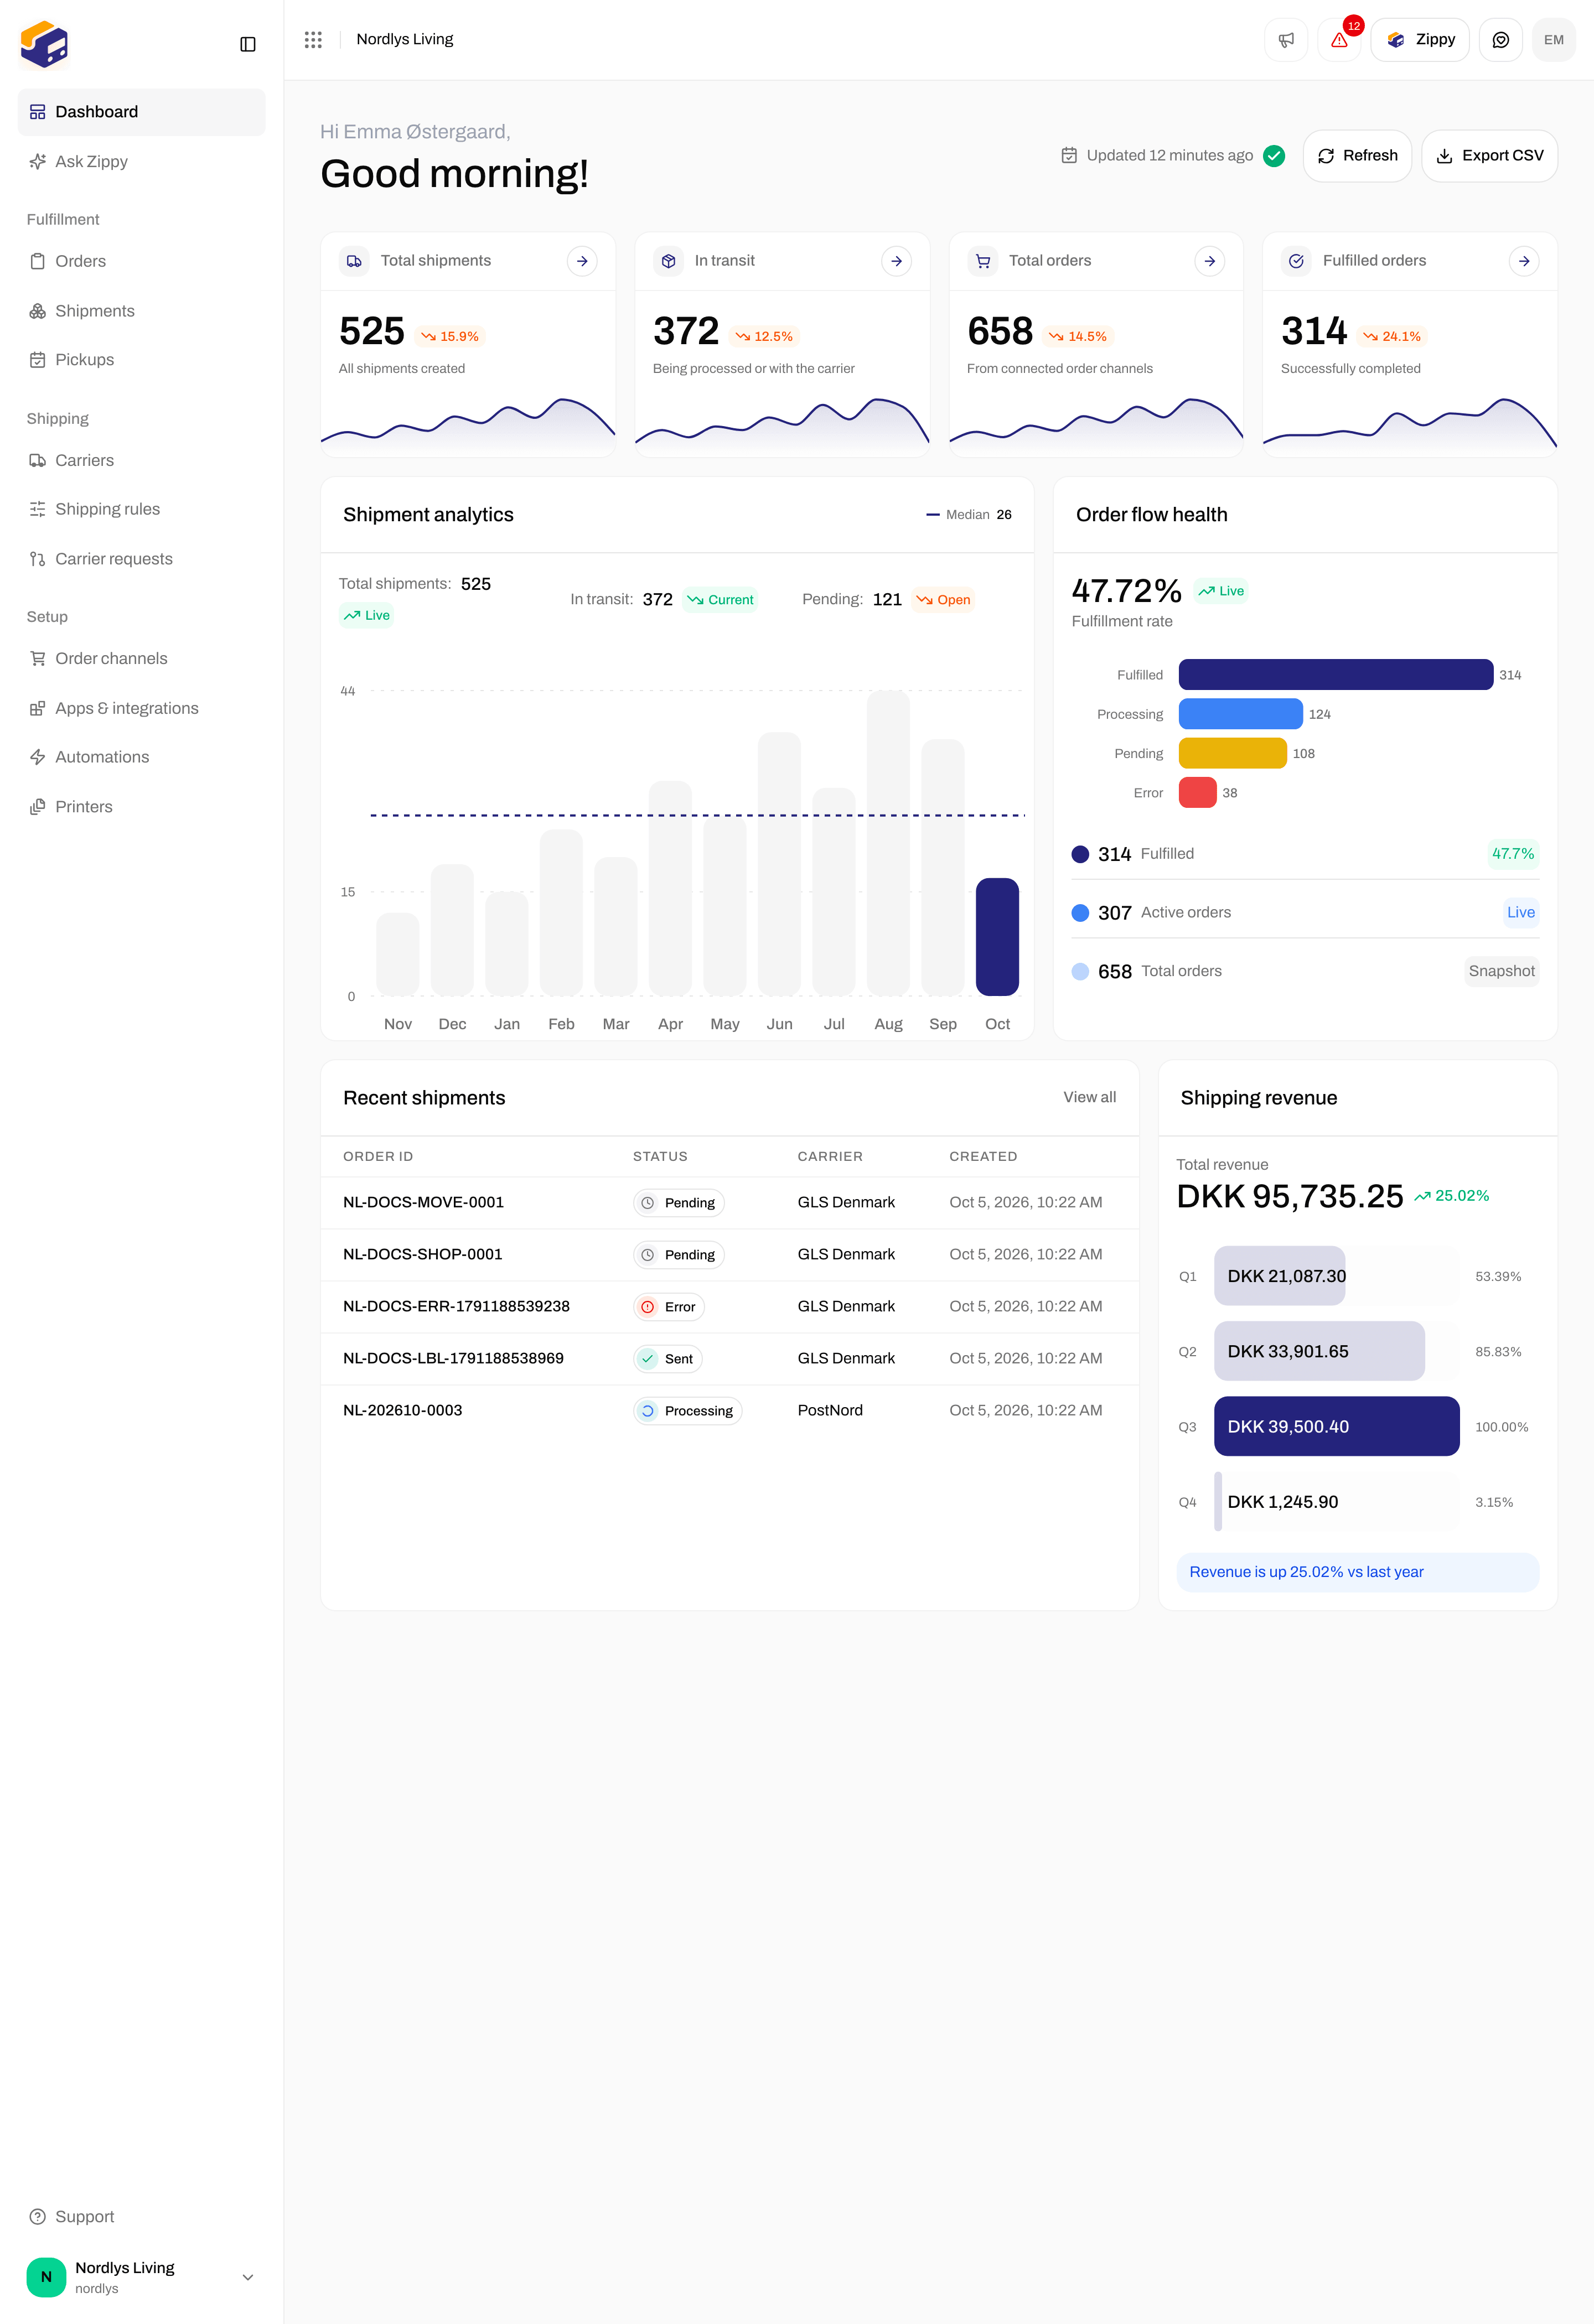
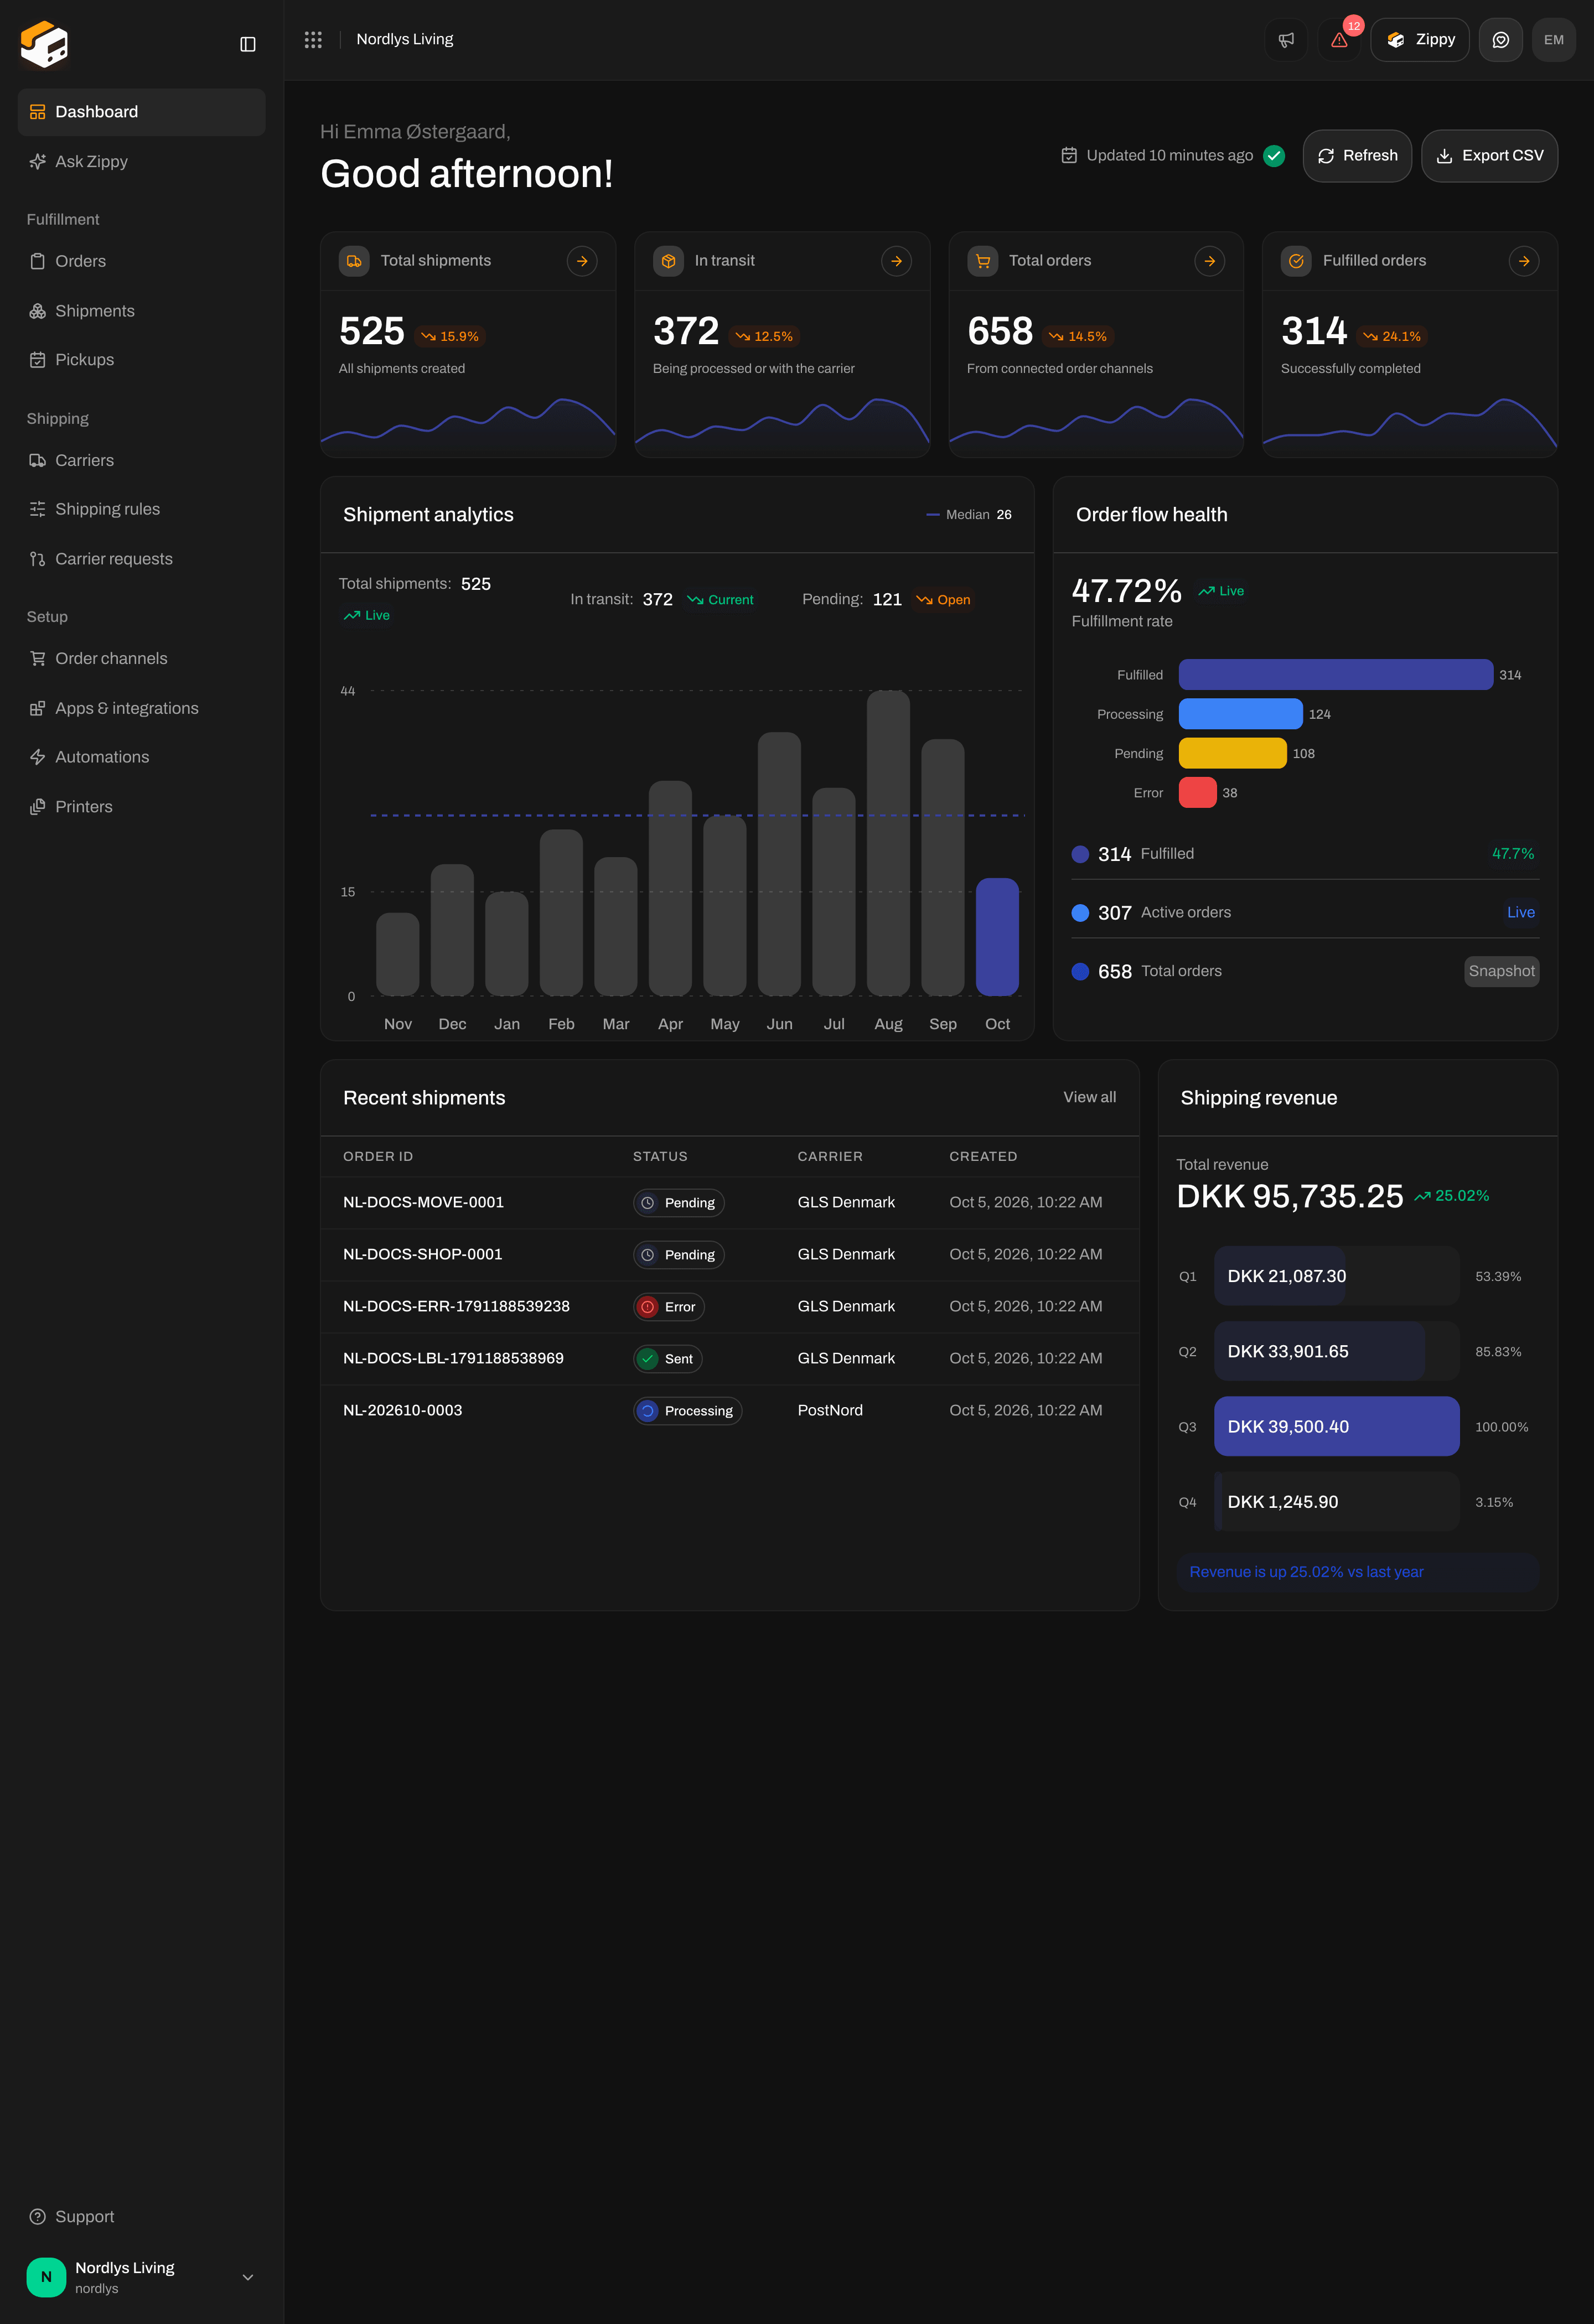
Further down the page: Recent shipments and Shipping revenue sit below the charts
Use it as your daily starting point
1
Check the greeting and how fresh the numbers are
The heading greets you with Good morning, Good afternoon or Good evening and your name. On the right, Updated shows when the numbers were last calculated. Refresh calculates them again. Export CSV downloads the same numbers as a file.
2
Look at the four key numbers
Check Total shipments, In transit, Total orders and Fulfilled orders. Each one shows the change from one month to the next and a small trend line for the last twelve months. Click the arrow on a card to open the matching list.
3
Check Order flow health
Order flow health shows your fulfillment rate and how many orders are Fulfilled, Processing, Pending or Partial. It tells you whether orders are moving or getting stuck.
4
Open work from Recent shipments
Scroll down to Recent shipments. Click a row to open that shipment. Shipping revenue next to it shows the value of your shipments per quarter.
Key numbers
The top row has four cards:
The big number is an all-time total. The percentage compares the last two complete months. The trend line shows that number month by month over the last twelve months.
Click the arrow (View all) on a card to go straight to the list.
Shipment analytics and Order flow health
Below the key numbers, two charts sit side by side. Shipment analytics shows how many shipments you created each month over the last twelve months, with a dashed Median line. Above the bars you see:- Total shipments: all shipments
- In transit: shipments on their way right now
- Pending: shipments not sent yet (draft, pending or on hold)
- Fulfillment rate: fulfilled orders divided by all orders
- Bars for the most common statuses (for example Fulfilled, Processing, Pending, Partial)
- Totals for Fulfilled, Active orders (every order that is not fulfilled or cancelled) and Total orders
Recent shipments and revenue
Scroll past the charts. The bottom row has Recent shipments and Shipping revenue.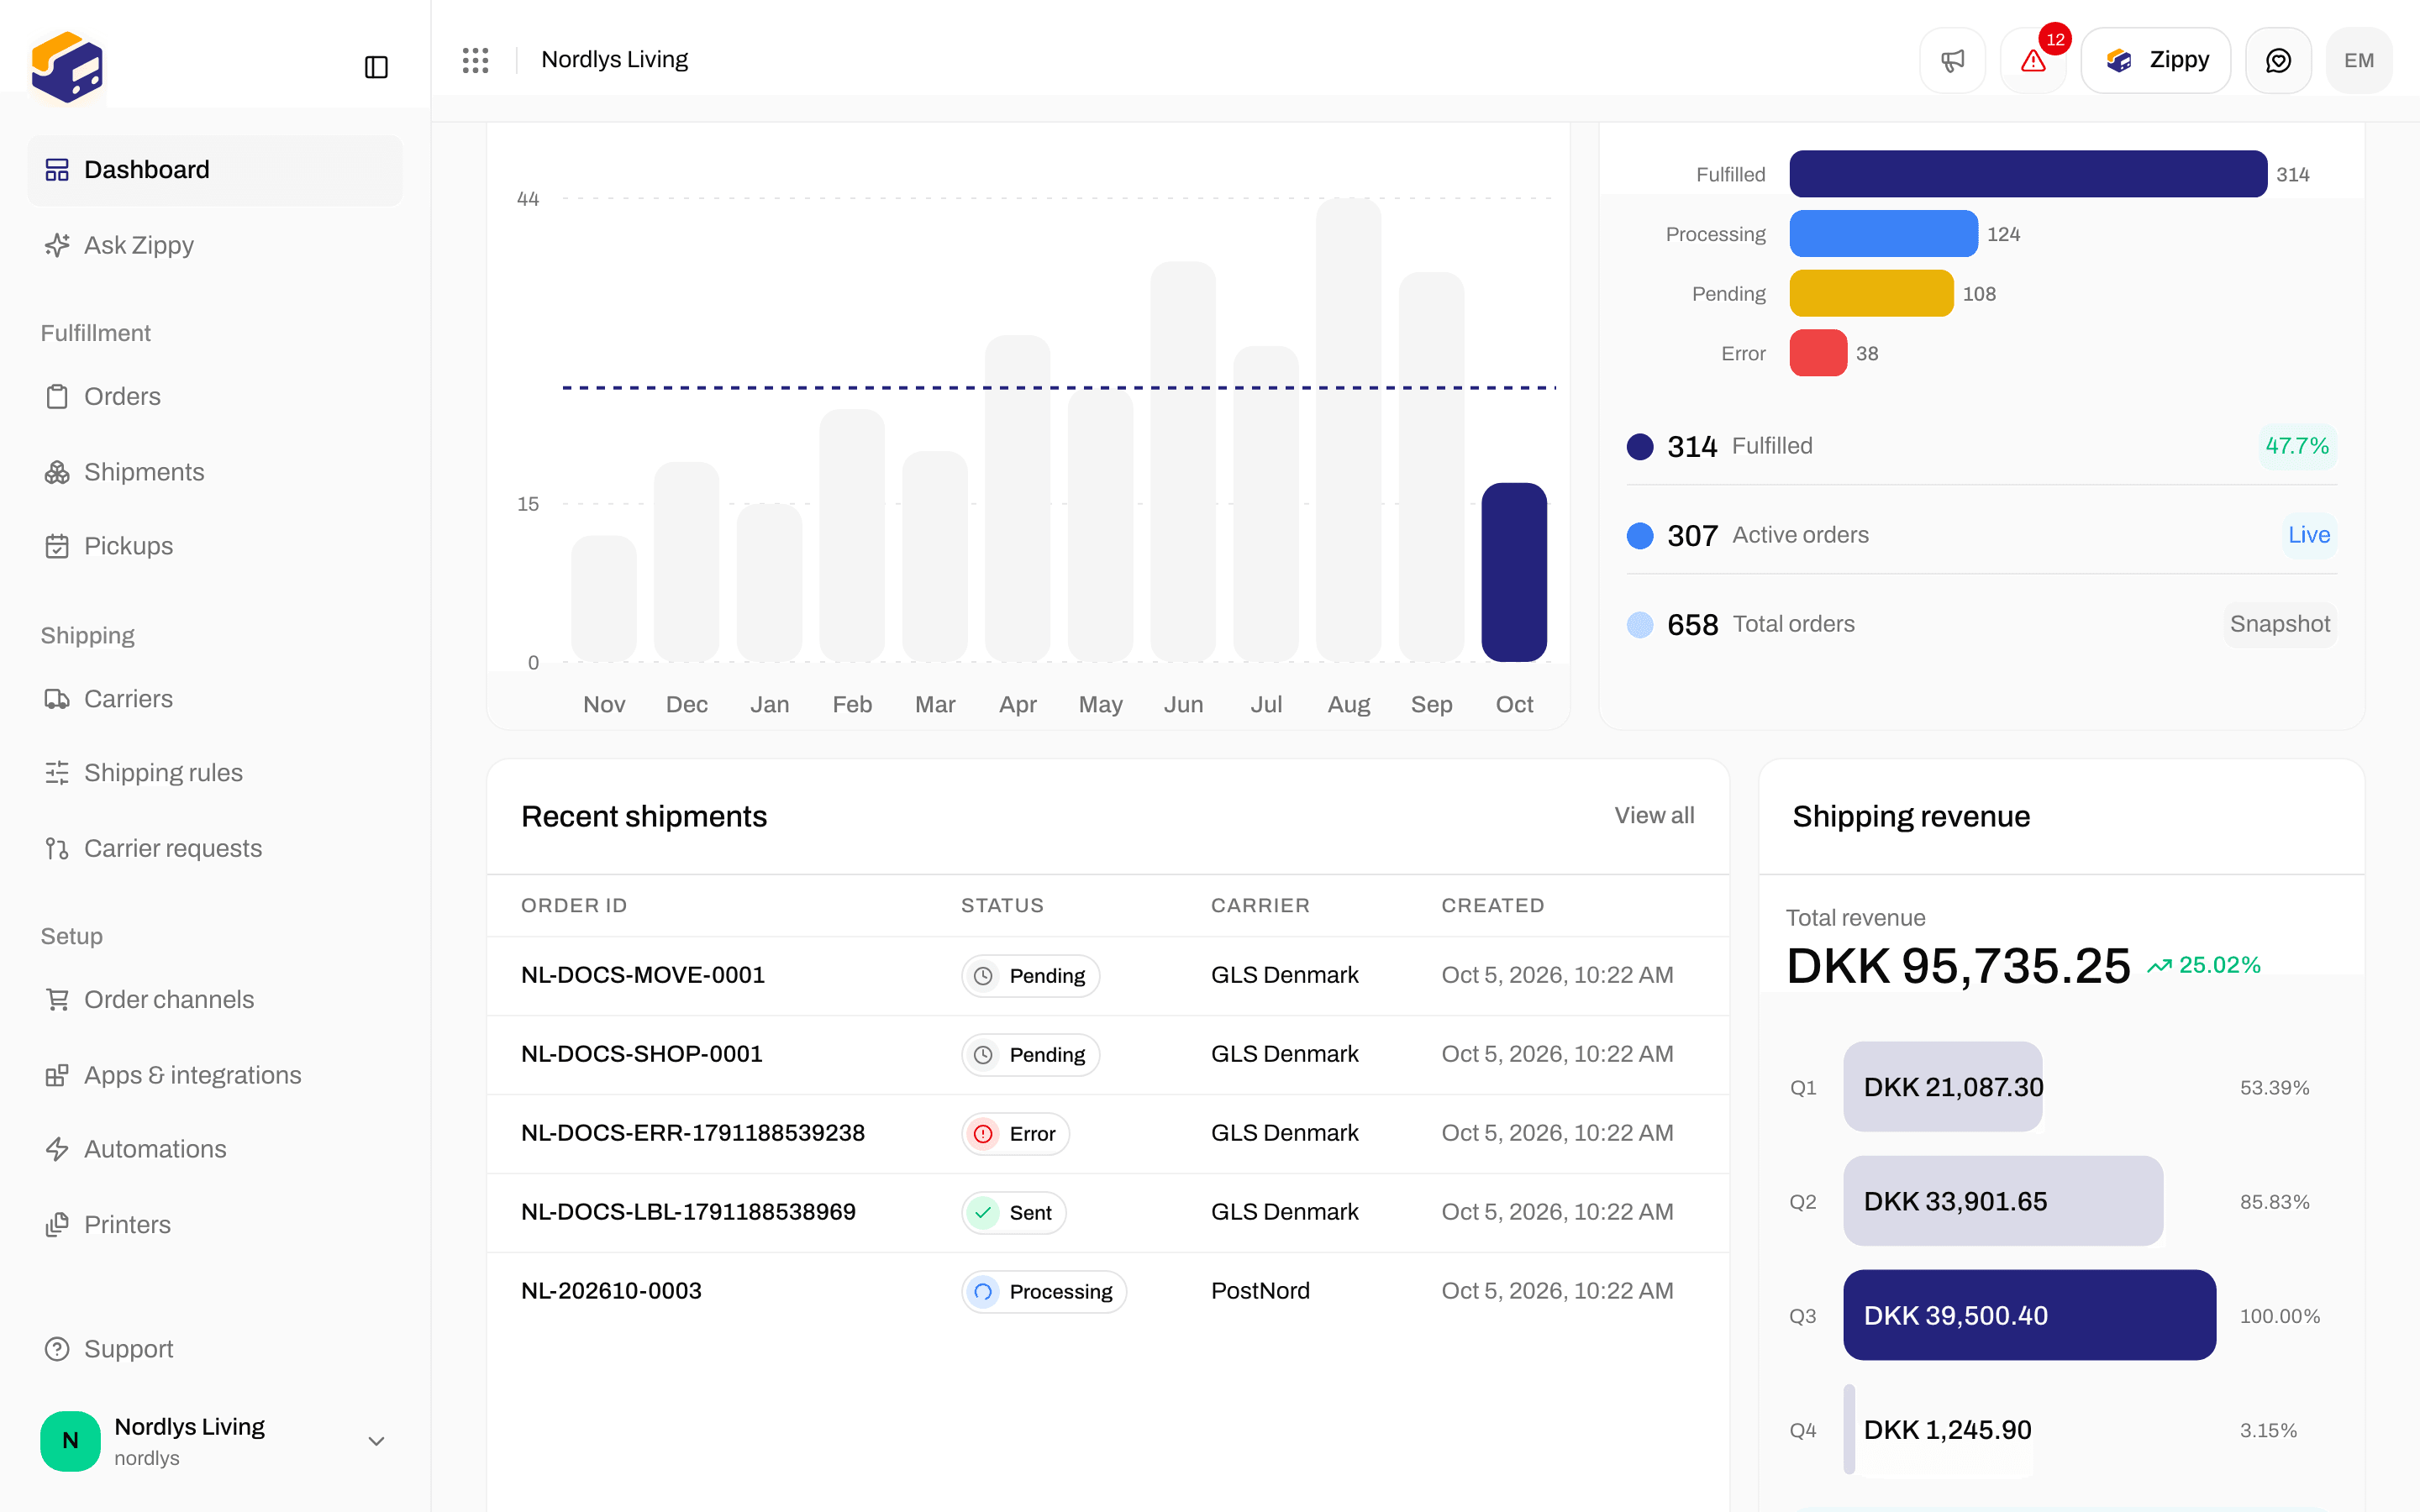
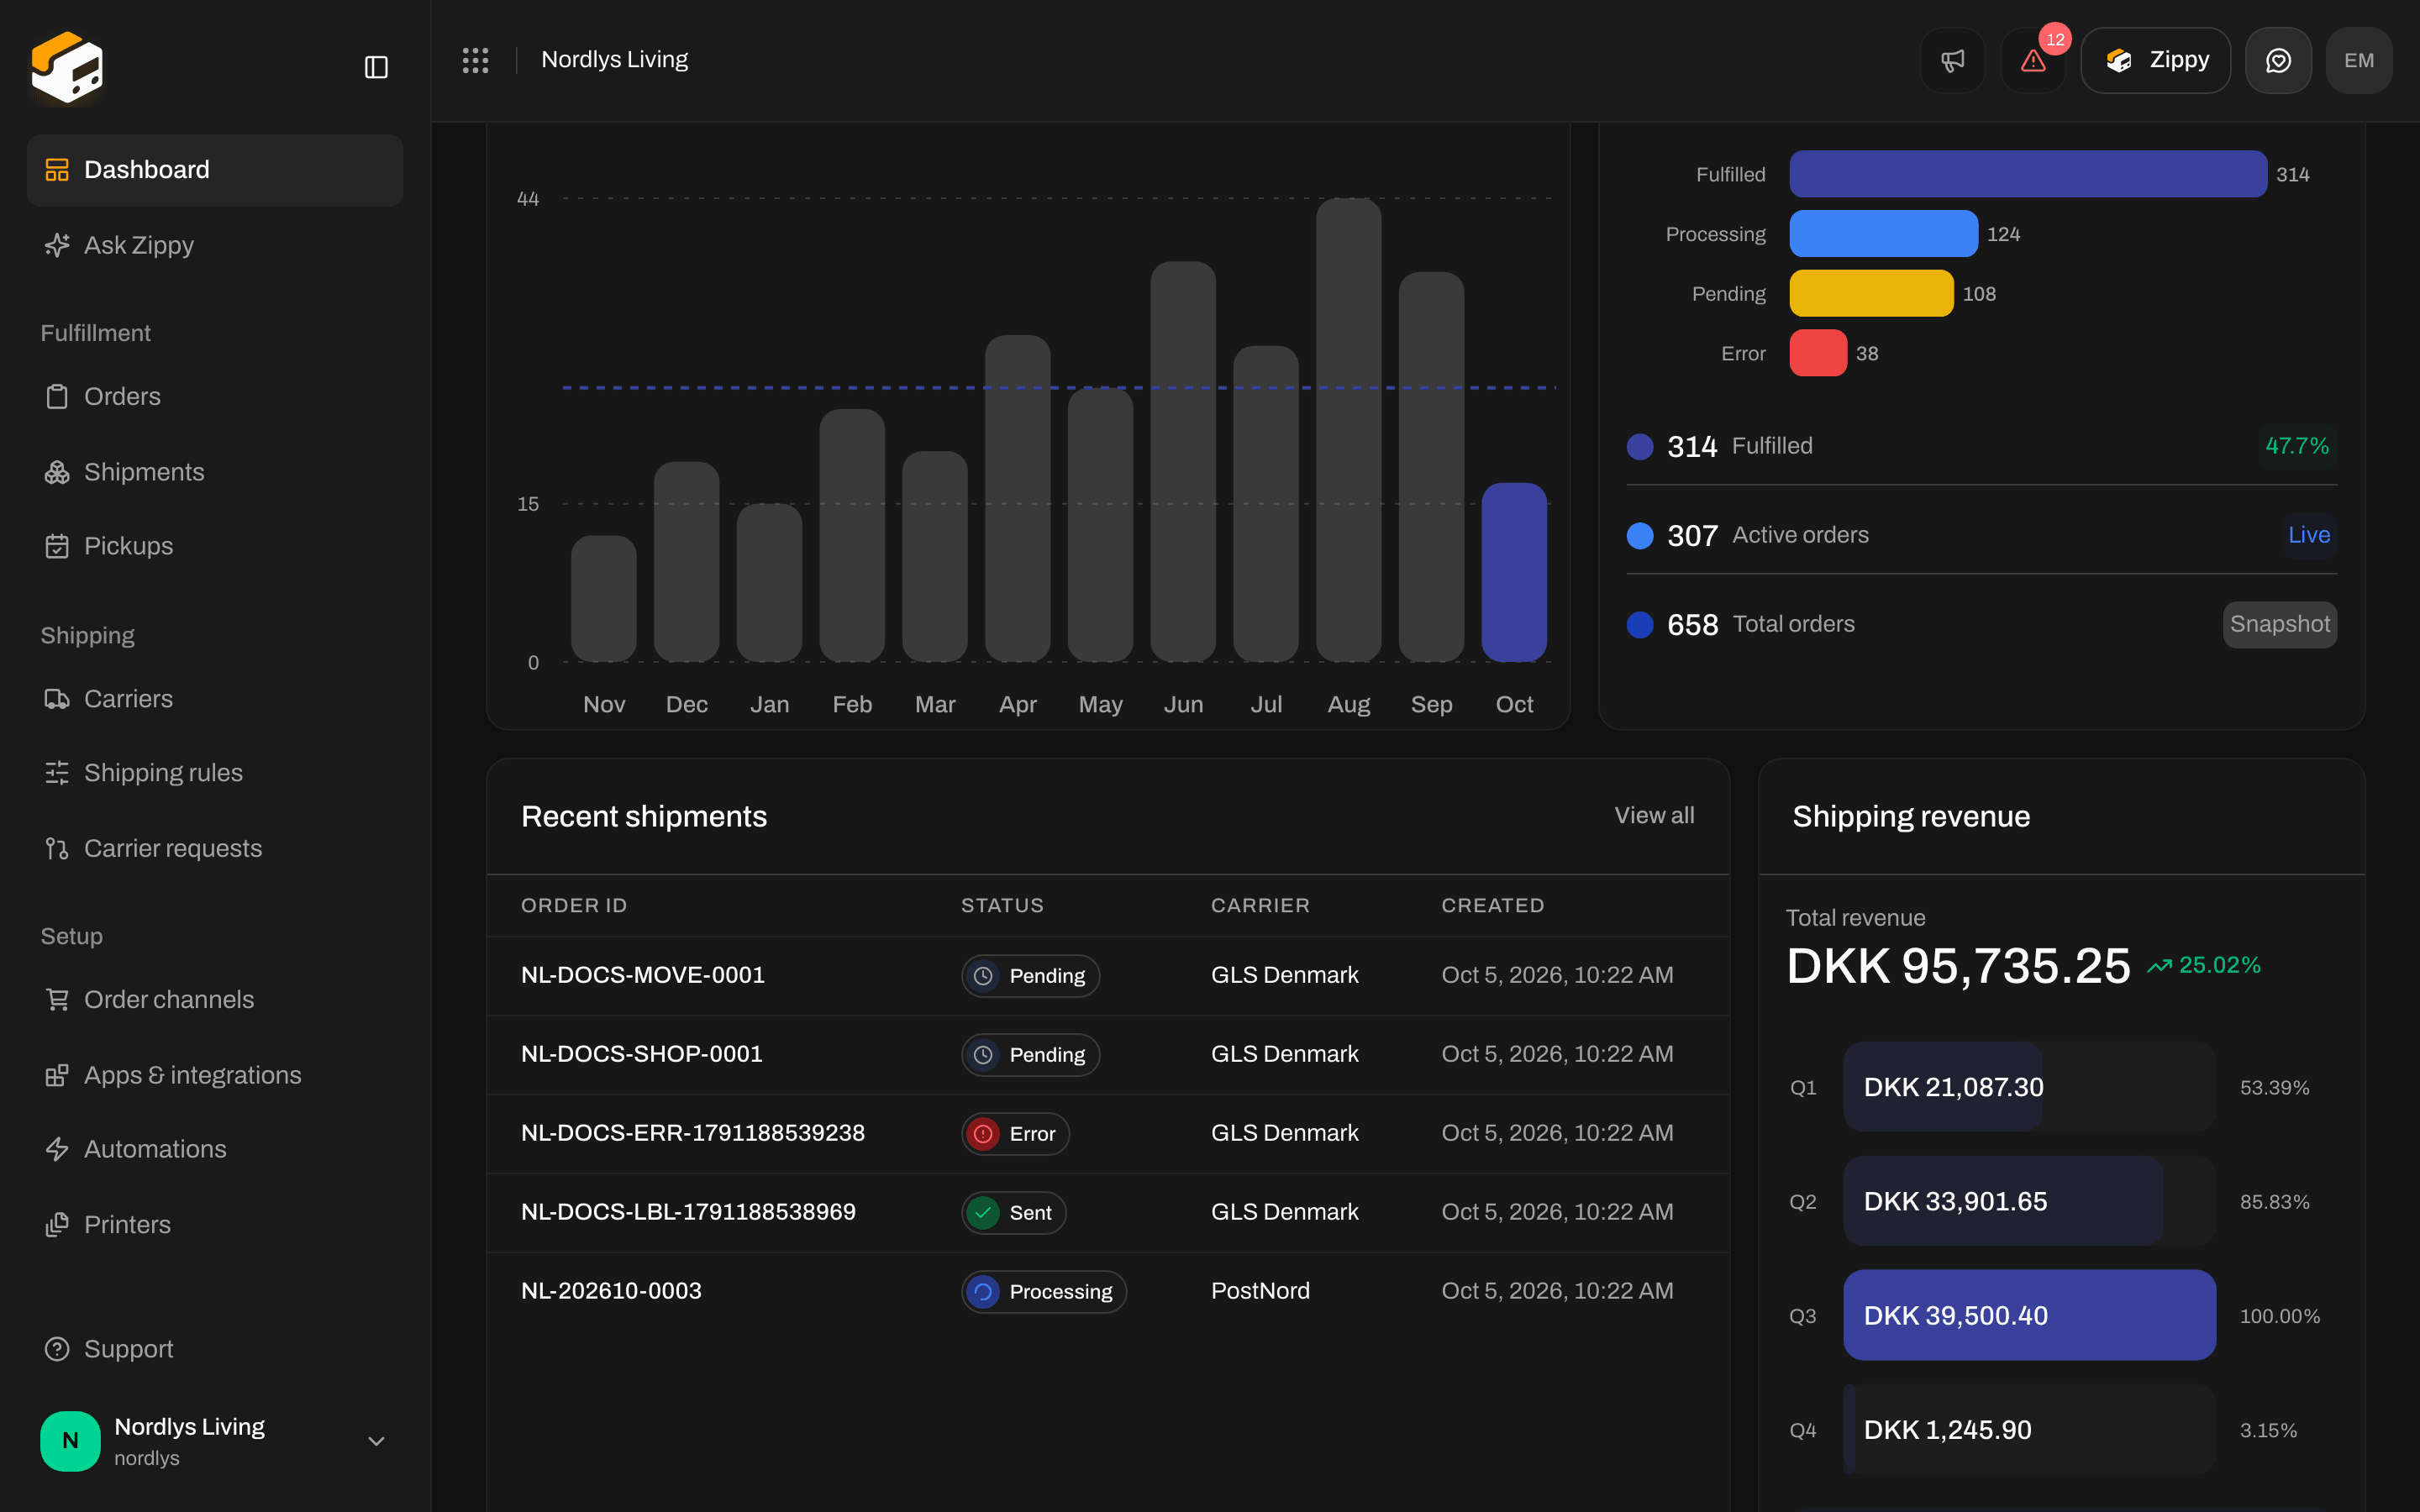
Further down: Recent shipments (your latest shipments) and Shipping revenue (this year, per quarter)
You can’t pick your own dates on Dashboard. To see different numbers, switch organization or brand (see below), or open Orders or Shipments and filter there.
Refresh and CSV
Zippendo keeps the Dashboard’s numbers for up to an hour before it calculates them again.- Updated: how long ago the numbers were calculated. Point at it to see the exact time.
- Refresh: calculates the numbers again right now. A message confirms Dashboard updated.
- Export CSV: downloads the numbers and lists on the page (the overview, shipments per month, revenue per quarter, orders by status and recent shipments).
Brands
Dashboard follows the brand you have picked. The numbers, charts and Recent shipments only count that brand. If your organization has brands, a brand picker sits at the top of the sidebar. Pick a brand, or All brands to see the whole organization. Without brands, the picker is hidden. There are no extra brand filters on the page itself. Setting up brands: Settings, team, and brands and Brands. Switching organization: Switching organizations.Empty or full
A Dashboard in use looks like the pictures above: numbers above zero, a twelve-month chart, status bars, and rows under Recent shipments. A new organization shows the same cards. The numbers are 0, the charts are flat and Recent shipments says No shipments yet. The shipments you create appear here. That changes as soon as you create a shipment or your orders come in. Until setup is done, a Setup wizard card appears above the key numbers. It shows how many setup steps are done and the next one, and Continue setup opens the full list. The card goes away once your organization has its first shipment. See Getting started. From 80% of the shipments included in your plan for the month, a usage warning appears at the top of the page.Dashboard never hides cards when there is no data. An empty Dashboard shows zeros and empty charts, in the same layout.
What to open next
Orders
Ship the orders from your webshop, from the list or from each order.
Create a shipment
Create a shipment from Shipments or from an order.
Labels and printing
Send a pending shipment and print the label.
Getting started
Sender address, first carrier and the setup wizard.