> ## Documentation Index
> Fetch the complete documentation index at: https://www.zippendo.com/docs/llms.txt
> Use this file to discover all available pages before exploring further.
# Dashboard
> Use the Zippendo dashboard as your daily starting point — stats, charts, recent shipments, and jumps into orders.
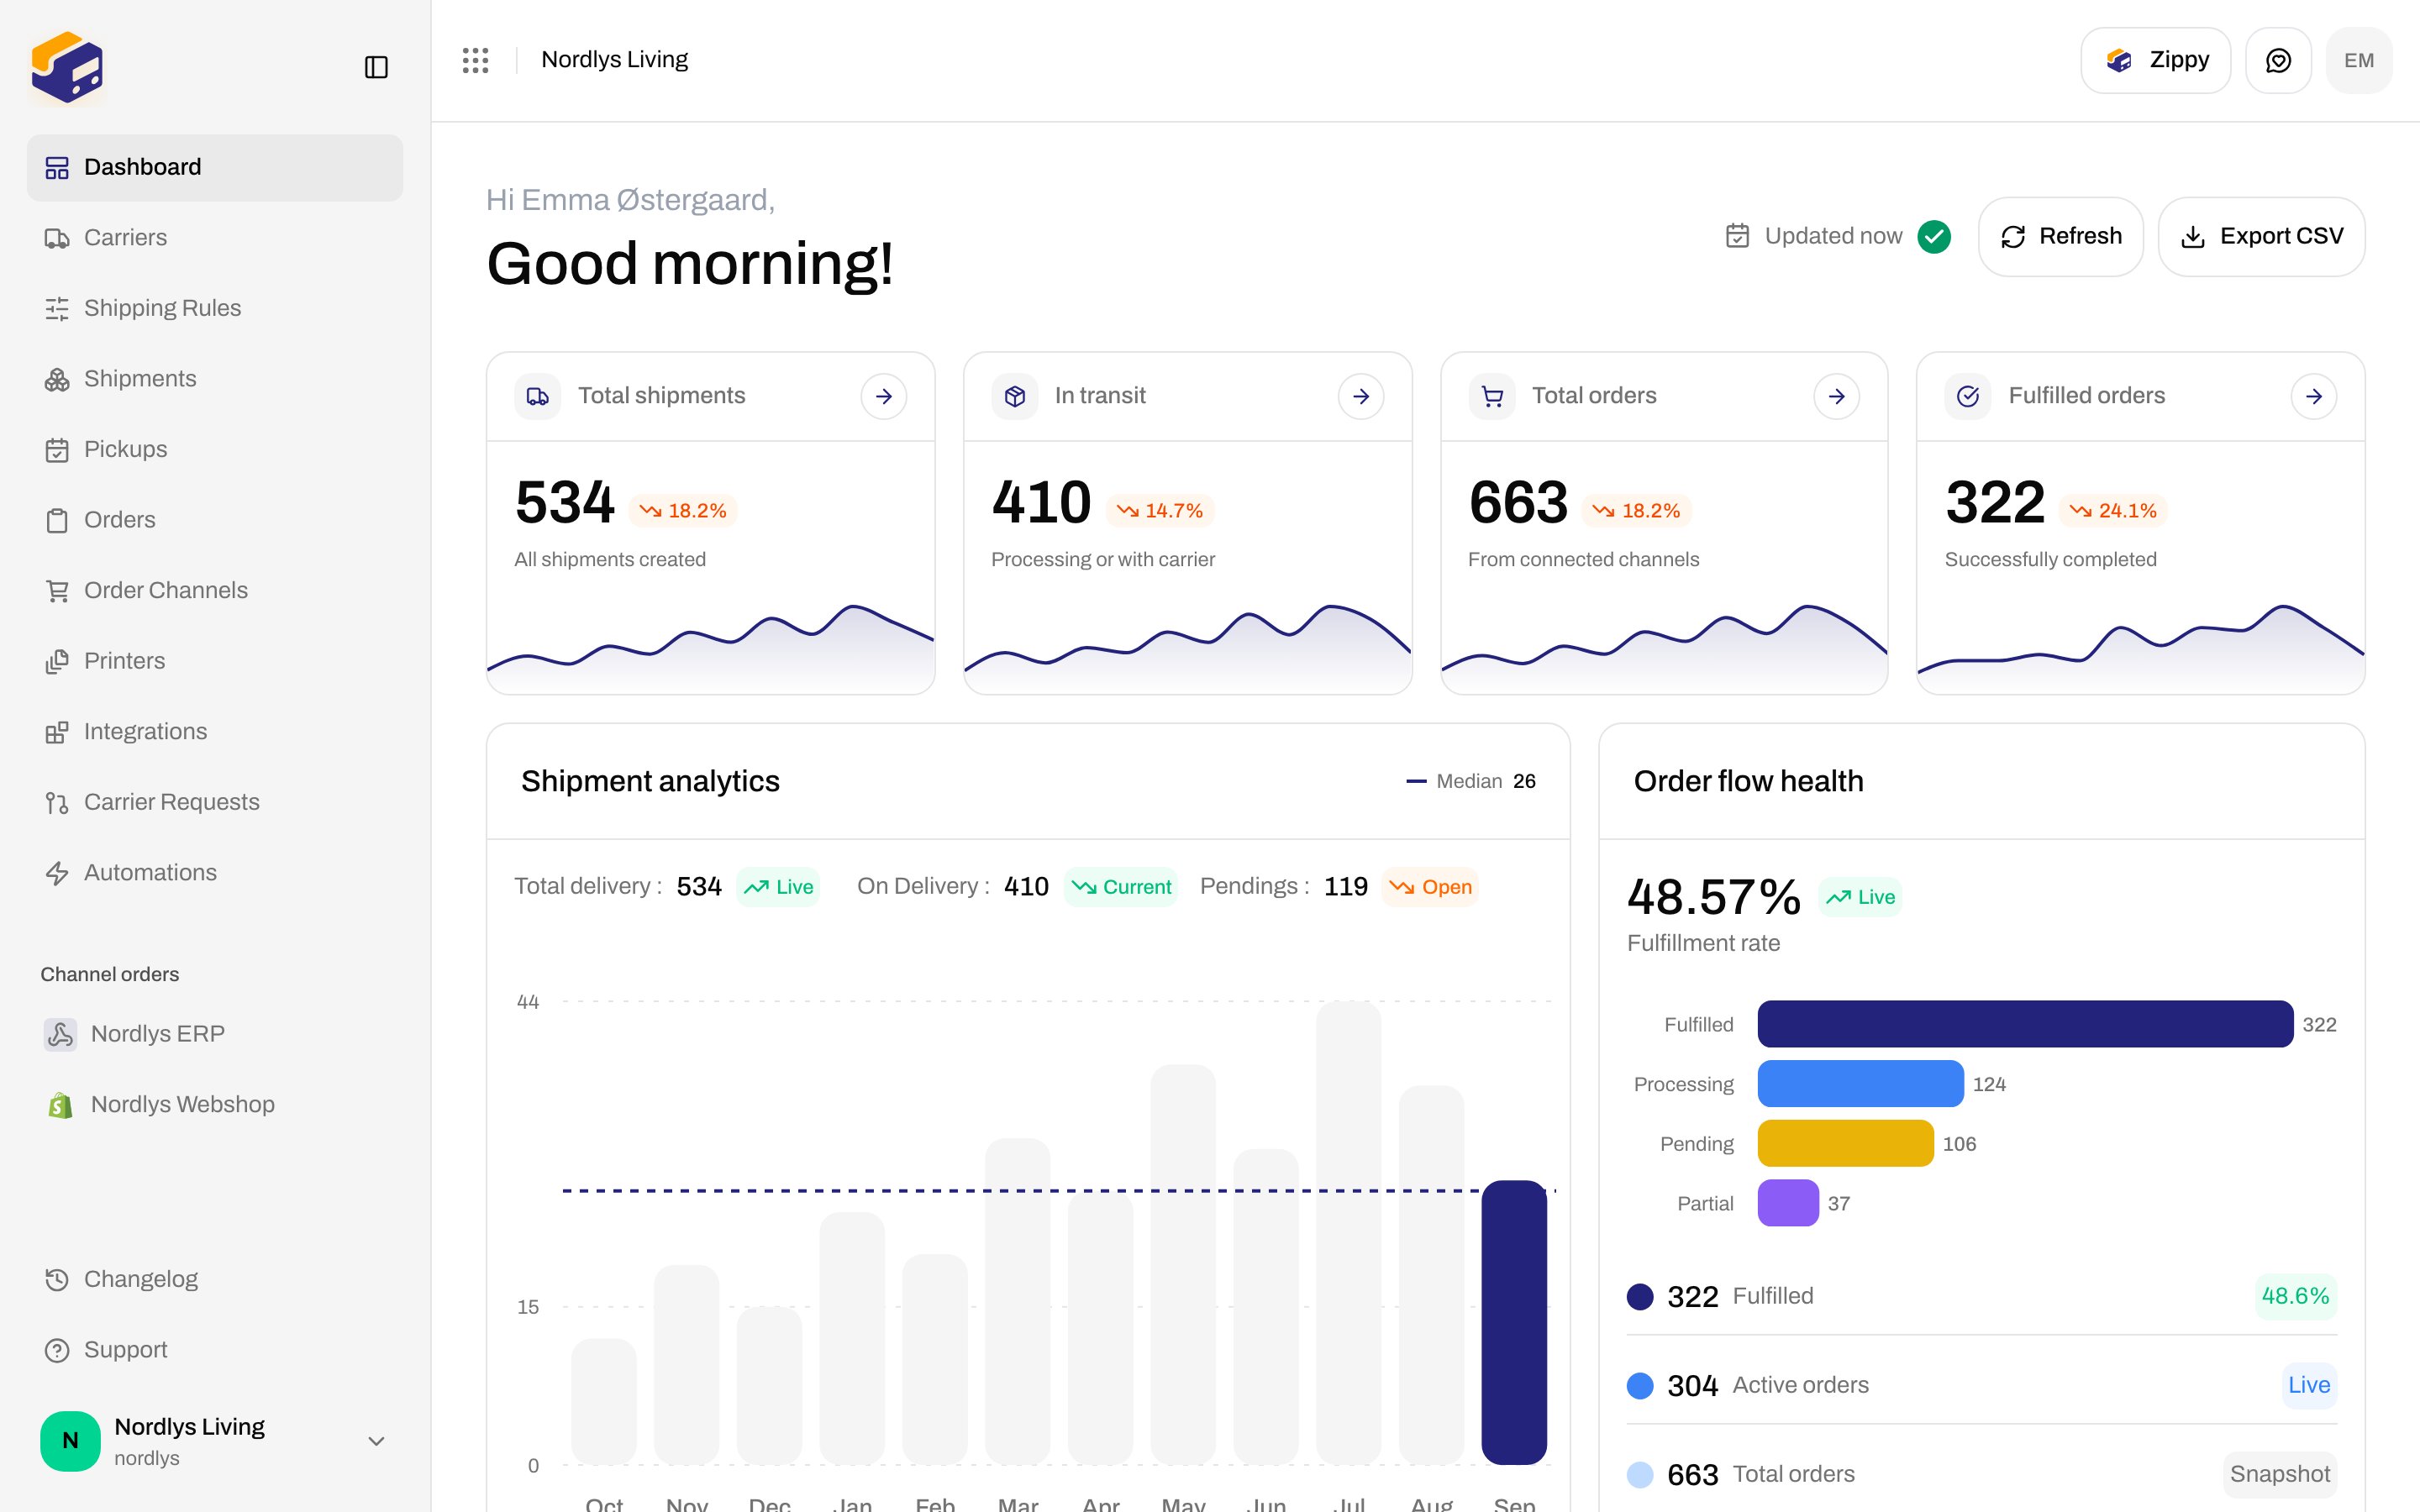
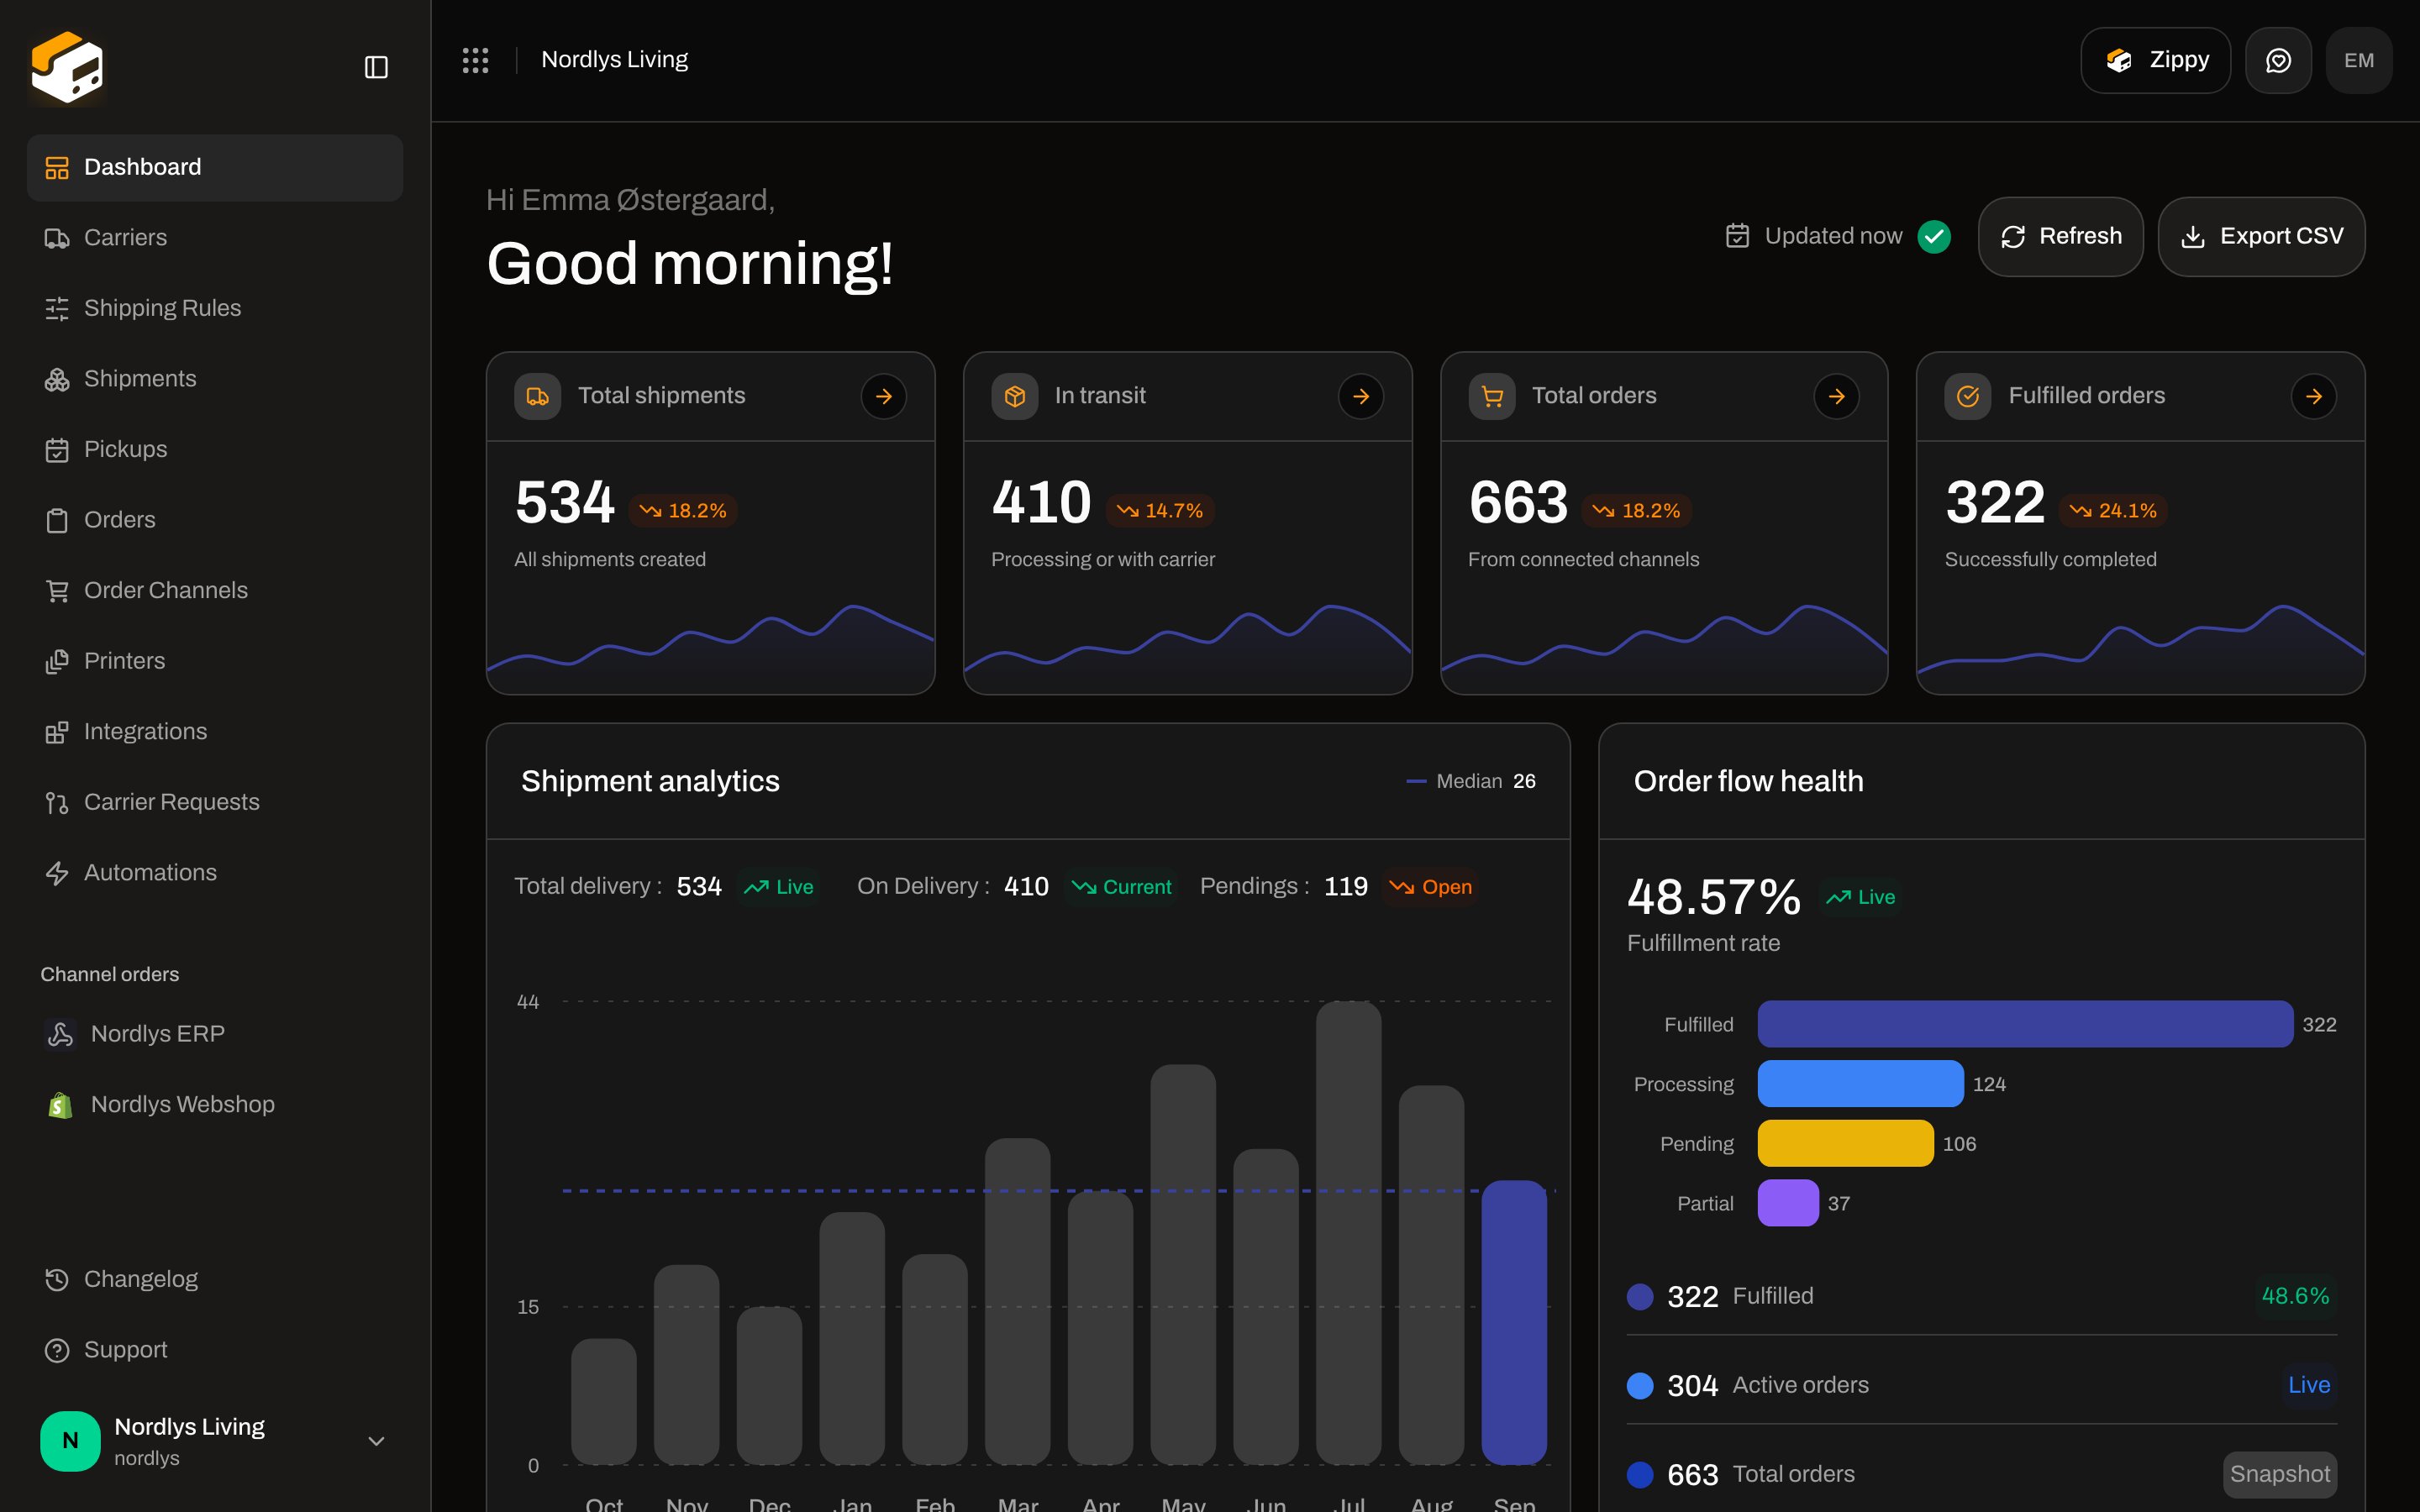
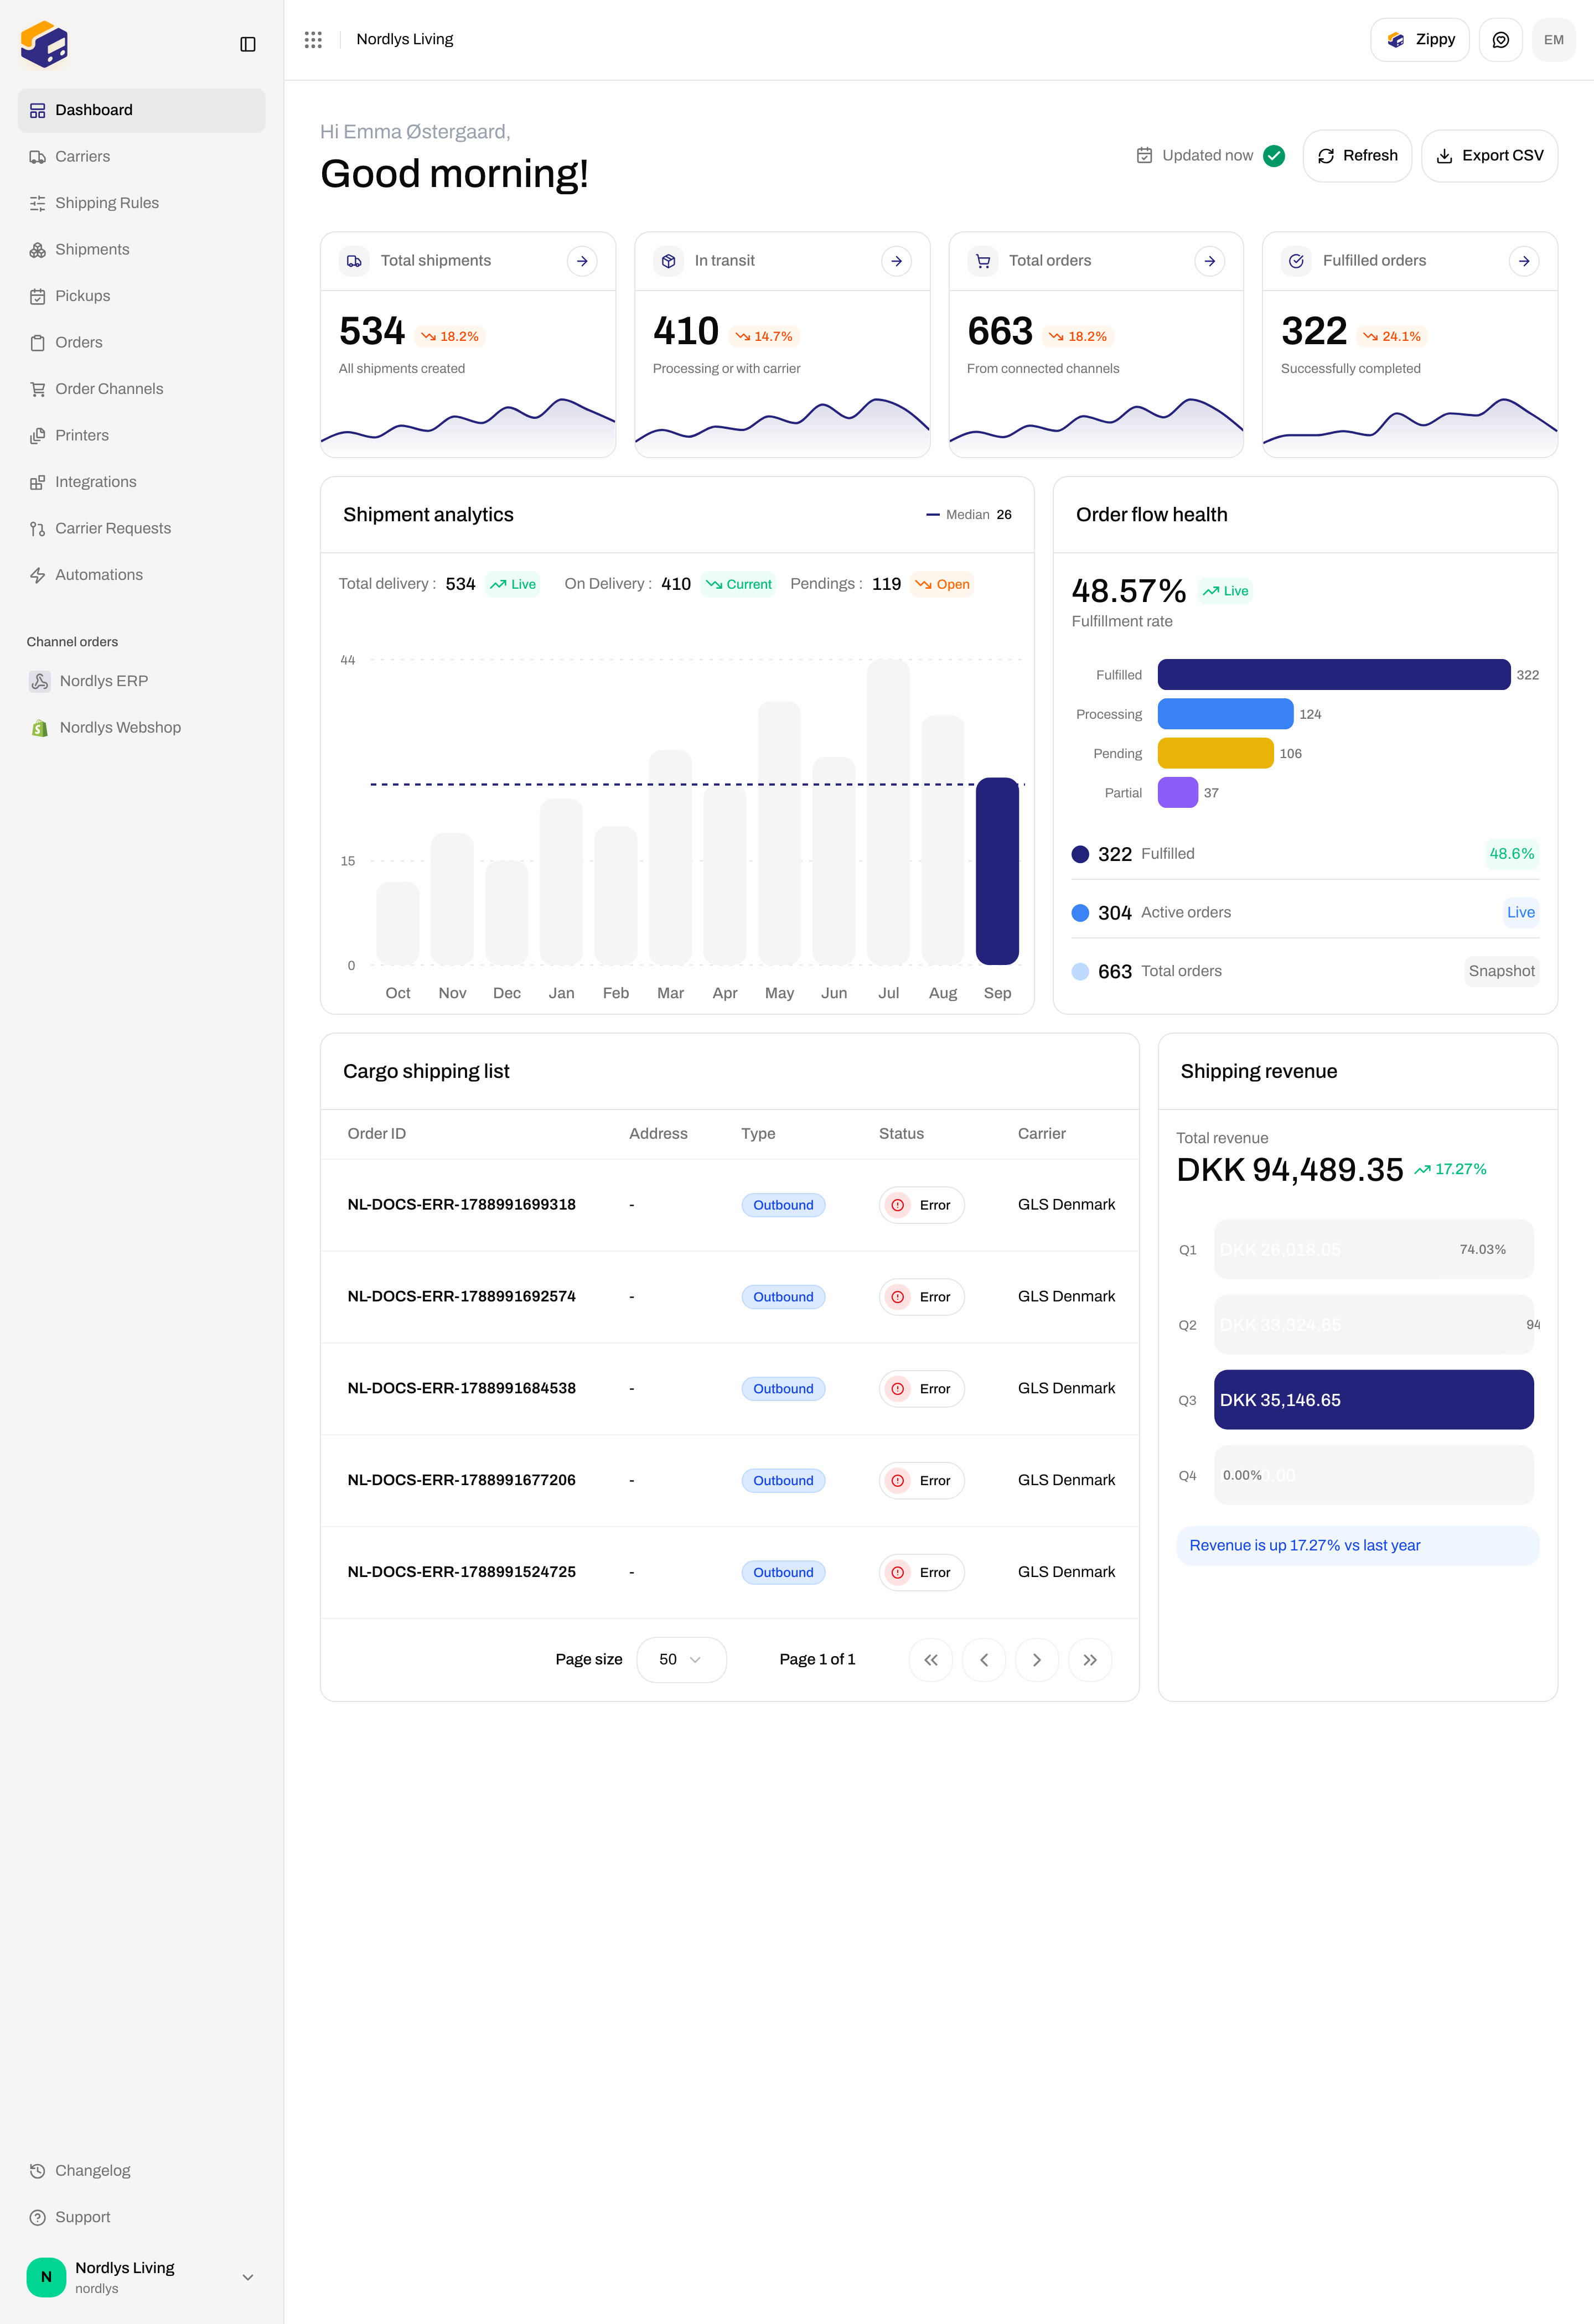
After you sign in, **Dashboard** is the first screen. It is an operations snapshot for the organization (and brand) you are in: lifetime counts, a twelve-month trend, order-status health, the latest shipments, and shipping revenue.
There is no date-range picker on this page. The headline numbers are lifetime totals. The sparklines and **Shipment analytics** chart cover the last twelve months. **Shipping revenue** is the current calendar year, broken into quarters.
 ## Use it as a daily starting point
The heading is time-of-day copy: **Good morning**, **Good afternoon**, or **Good evening**, plus **Hi** and your name. On the right, **Updated** shows how recent the payload is. **Refresh** recomputes it. **Export CSV** downloads the same snapshot.
Check **Total shipments**, **In transit**, **Total orders**, and **Fulfilled orders**. Each card has a month-over-month chip and a twelve-month sparkline. Use the arrow on a card to open the matching list.
**Order flow health** shows fulfillment rate and how orders sit in **Fulfilled**, **Processing**, **Pending**, and **Partial**. That tells you whether the queue is moving or stuck.
Scroll to **Cargo shipping list**. Click a row to open that shipment. Use **Shipping revenue** beside it if you need a quarterly view of booked value.
Start here, then jump. The dashboard does not replace **Orders** or **Shipments** — it tells you which list to open next.
## Headline stats
The top row is four cards:
| Card | Subtitle | Arrow opens |
| -------------------- | -------------------------- | -------------------------------- |
| **Total shipments** | All shipments created | [Shipments](/docs/shipments/overview) |
| **In transit** | Processing or with carrier | [Shipments](/docs/shipments/overview) |
| **Total orders** | From connected channels | [Orders](/docs/tutorials/orders) |
| **Fulfilled orders** | Successfully completed | [Orders](/docs/tutorials/orders) |
The large number is a lifetime count. The percentage chip compares the last two complete months. The sparkline is monthly history for that metric over the last twelve months.
Click the arrow (**View all**) on a card to go straight to the list.
## Shipment analytics and order flow health
Under the stats, two charts sit side by side.
**Shipment analytics** plots monthly shipment volume (last twelve months) with a dashed **Median** line. Above the bars you get:
* **Total delivery** — all shipments
* **On Delivery** — shipments currently in transit
* **Pendings** — still open (draft, pending, or on hold)
**Order flow health** is a snapshot of orders by status (not a time series). It shows:
* **Fulfillment rate** — fulfilled orders ÷ total orders
* Bars for the busiest statuses (for example **Fulfilled**, **Processing**, **Pending**, **Partial**)
* Totals for **Fulfilled**, **Active orders** (everything except fulfilled and cancelled), and **Total orders**
Use this card to decide whether to open **Orders** filtered to **Pending** or **Processing**. See [Order statuses](/docs/orders/order-statuses).
## Recent shipments and revenue
Scroll past the charts. The lower row is **Cargo shipping list** and **Shipping revenue**.
## Use it as a daily starting point
The heading is time-of-day copy: **Good morning**, **Good afternoon**, or **Good evening**, plus **Hi** and your name. On the right, **Updated** shows how recent the payload is. **Refresh** recomputes it. **Export CSV** downloads the same snapshot.
Check **Total shipments**, **In transit**, **Total orders**, and **Fulfilled orders**. Each card has a month-over-month chip and a twelve-month sparkline. Use the arrow on a card to open the matching list.
**Order flow health** shows fulfillment rate and how orders sit in **Fulfilled**, **Processing**, **Pending**, and **Partial**. That tells you whether the queue is moving or stuck.
Scroll to **Cargo shipping list**. Click a row to open that shipment. Use **Shipping revenue** beside it if you need a quarterly view of booked value.
Start here, then jump. The dashboard does not replace **Orders** or **Shipments** — it tells you which list to open next.
## Headline stats
The top row is four cards:
| Card | Subtitle | Arrow opens |
| -------------------- | -------------------------- | -------------------------------- |
| **Total shipments** | All shipments created | [Shipments](/docs/shipments/overview) |
| **In transit** | Processing or with carrier | [Shipments](/docs/shipments/overview) |
| **Total orders** | From connected channels | [Orders](/docs/tutorials/orders) |
| **Fulfilled orders** | Successfully completed | [Orders](/docs/tutorials/orders) |
The large number is a lifetime count. The percentage chip compares the last two complete months. The sparkline is monthly history for that metric over the last twelve months.
Click the arrow (**View all**) on a card to go straight to the list.
## Shipment analytics and order flow health
Under the stats, two charts sit side by side.
**Shipment analytics** plots monthly shipment volume (last twelve months) with a dashed **Median** line. Above the bars you get:
* **Total delivery** — all shipments
* **On Delivery** — shipments currently in transit
* **Pendings** — still open (draft, pending, or on hold)
**Order flow health** is a snapshot of orders by status (not a time series). It shows:
* **Fulfillment rate** — fulfilled orders ÷ total orders
* Bars for the busiest statuses (for example **Fulfilled**, **Processing**, **Pending**, **Partial**)
* Totals for **Fulfilled**, **Active orders** (everything except fulfilled and cancelled), and **Total orders**
Use this card to decide whether to open **Orders** filtered to **Pending** or **Processing**. See [Order statuses](/docs/orders/order-statuses).
## Recent shipments and revenue
Scroll past the charts. The lower row is **Cargo shipping list** and **Shipping revenue**.
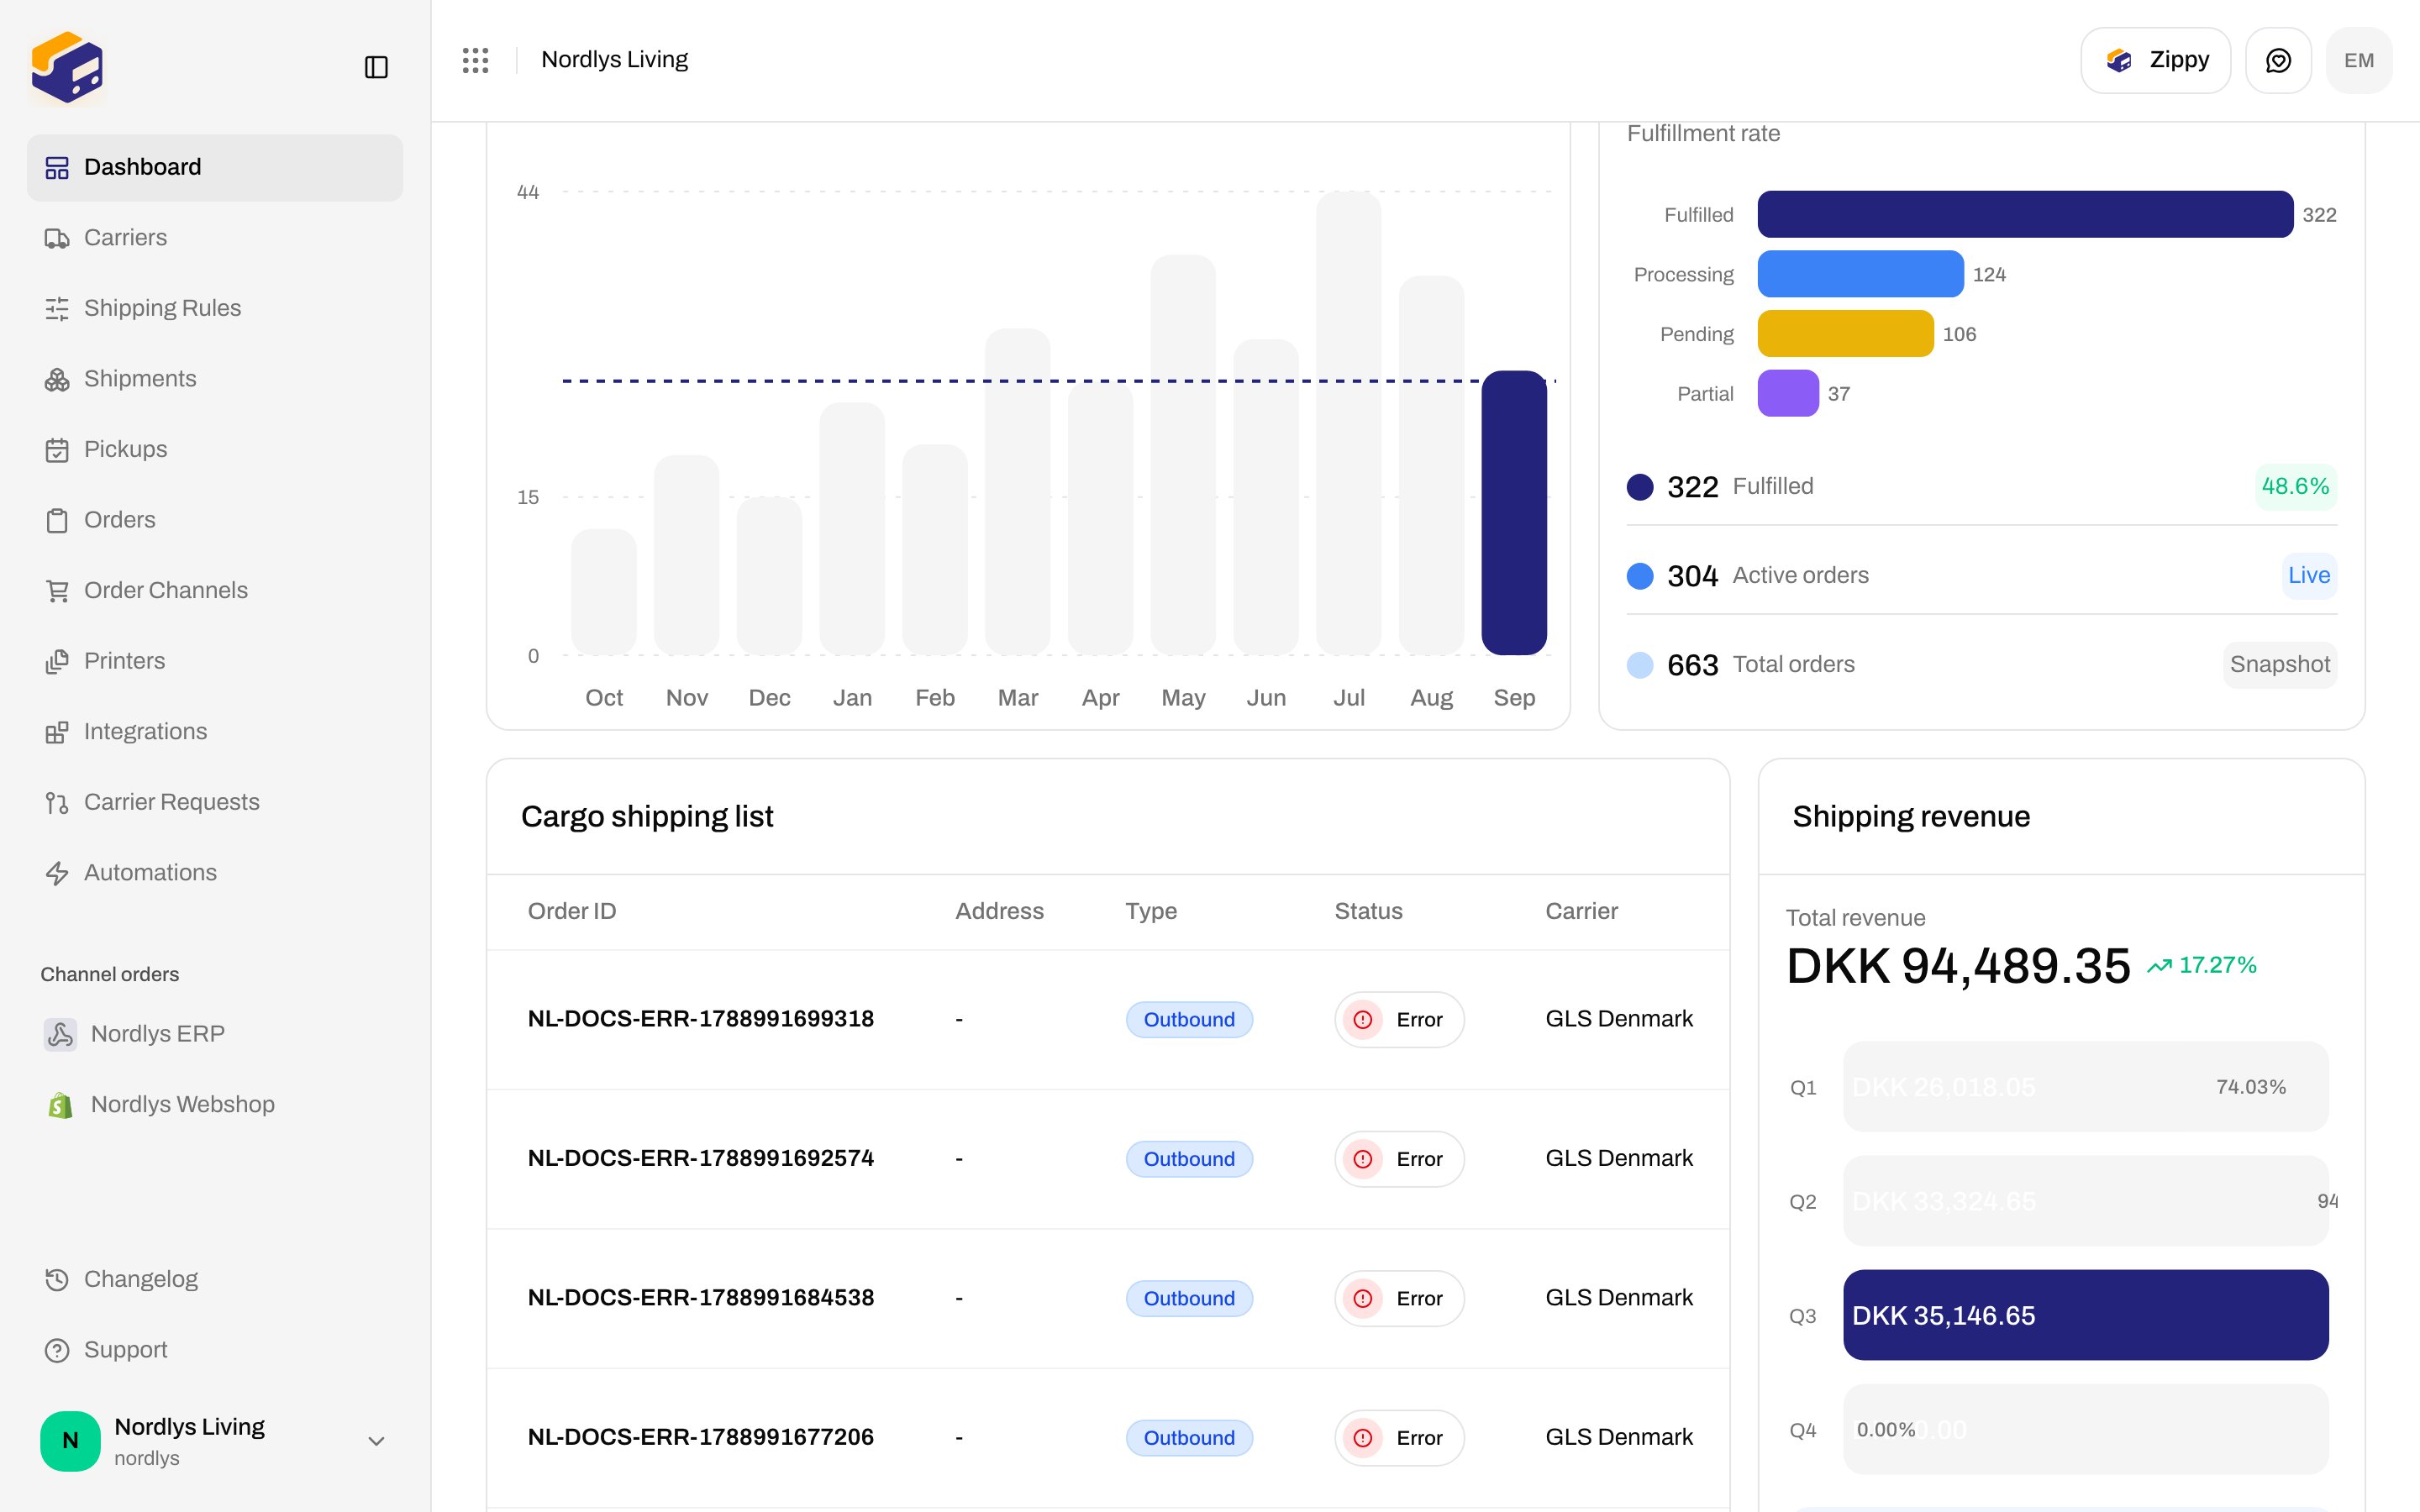
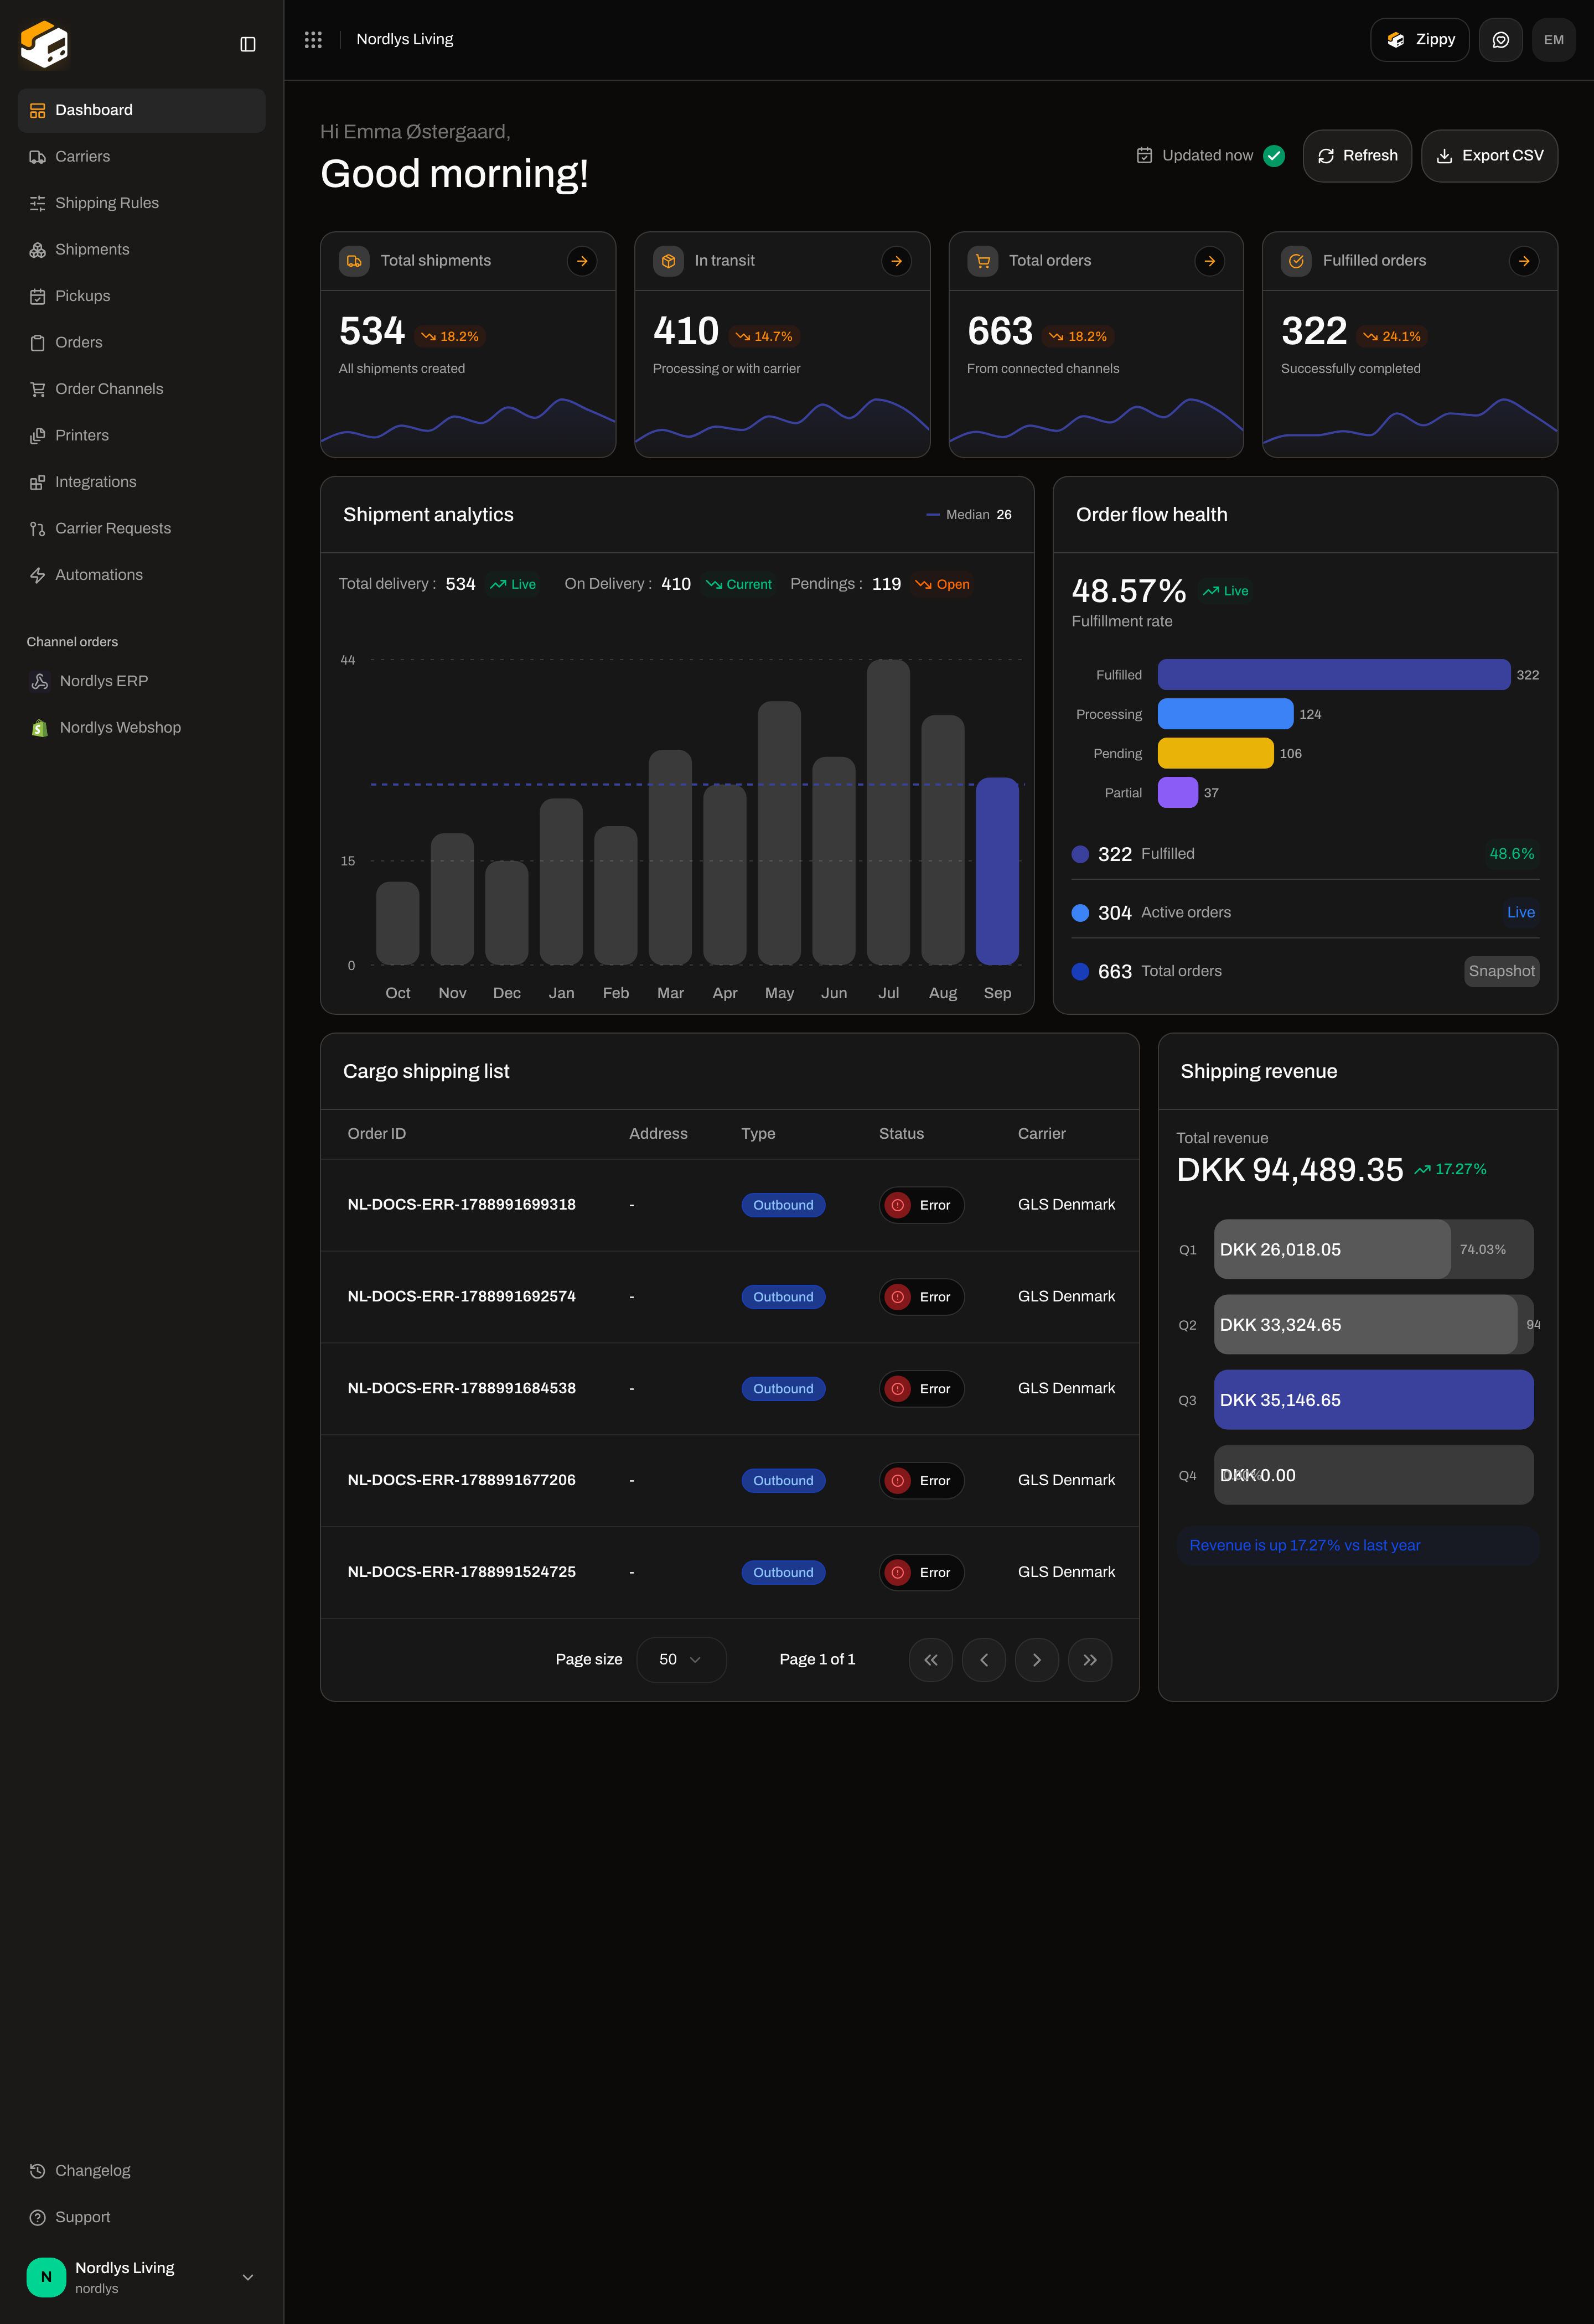
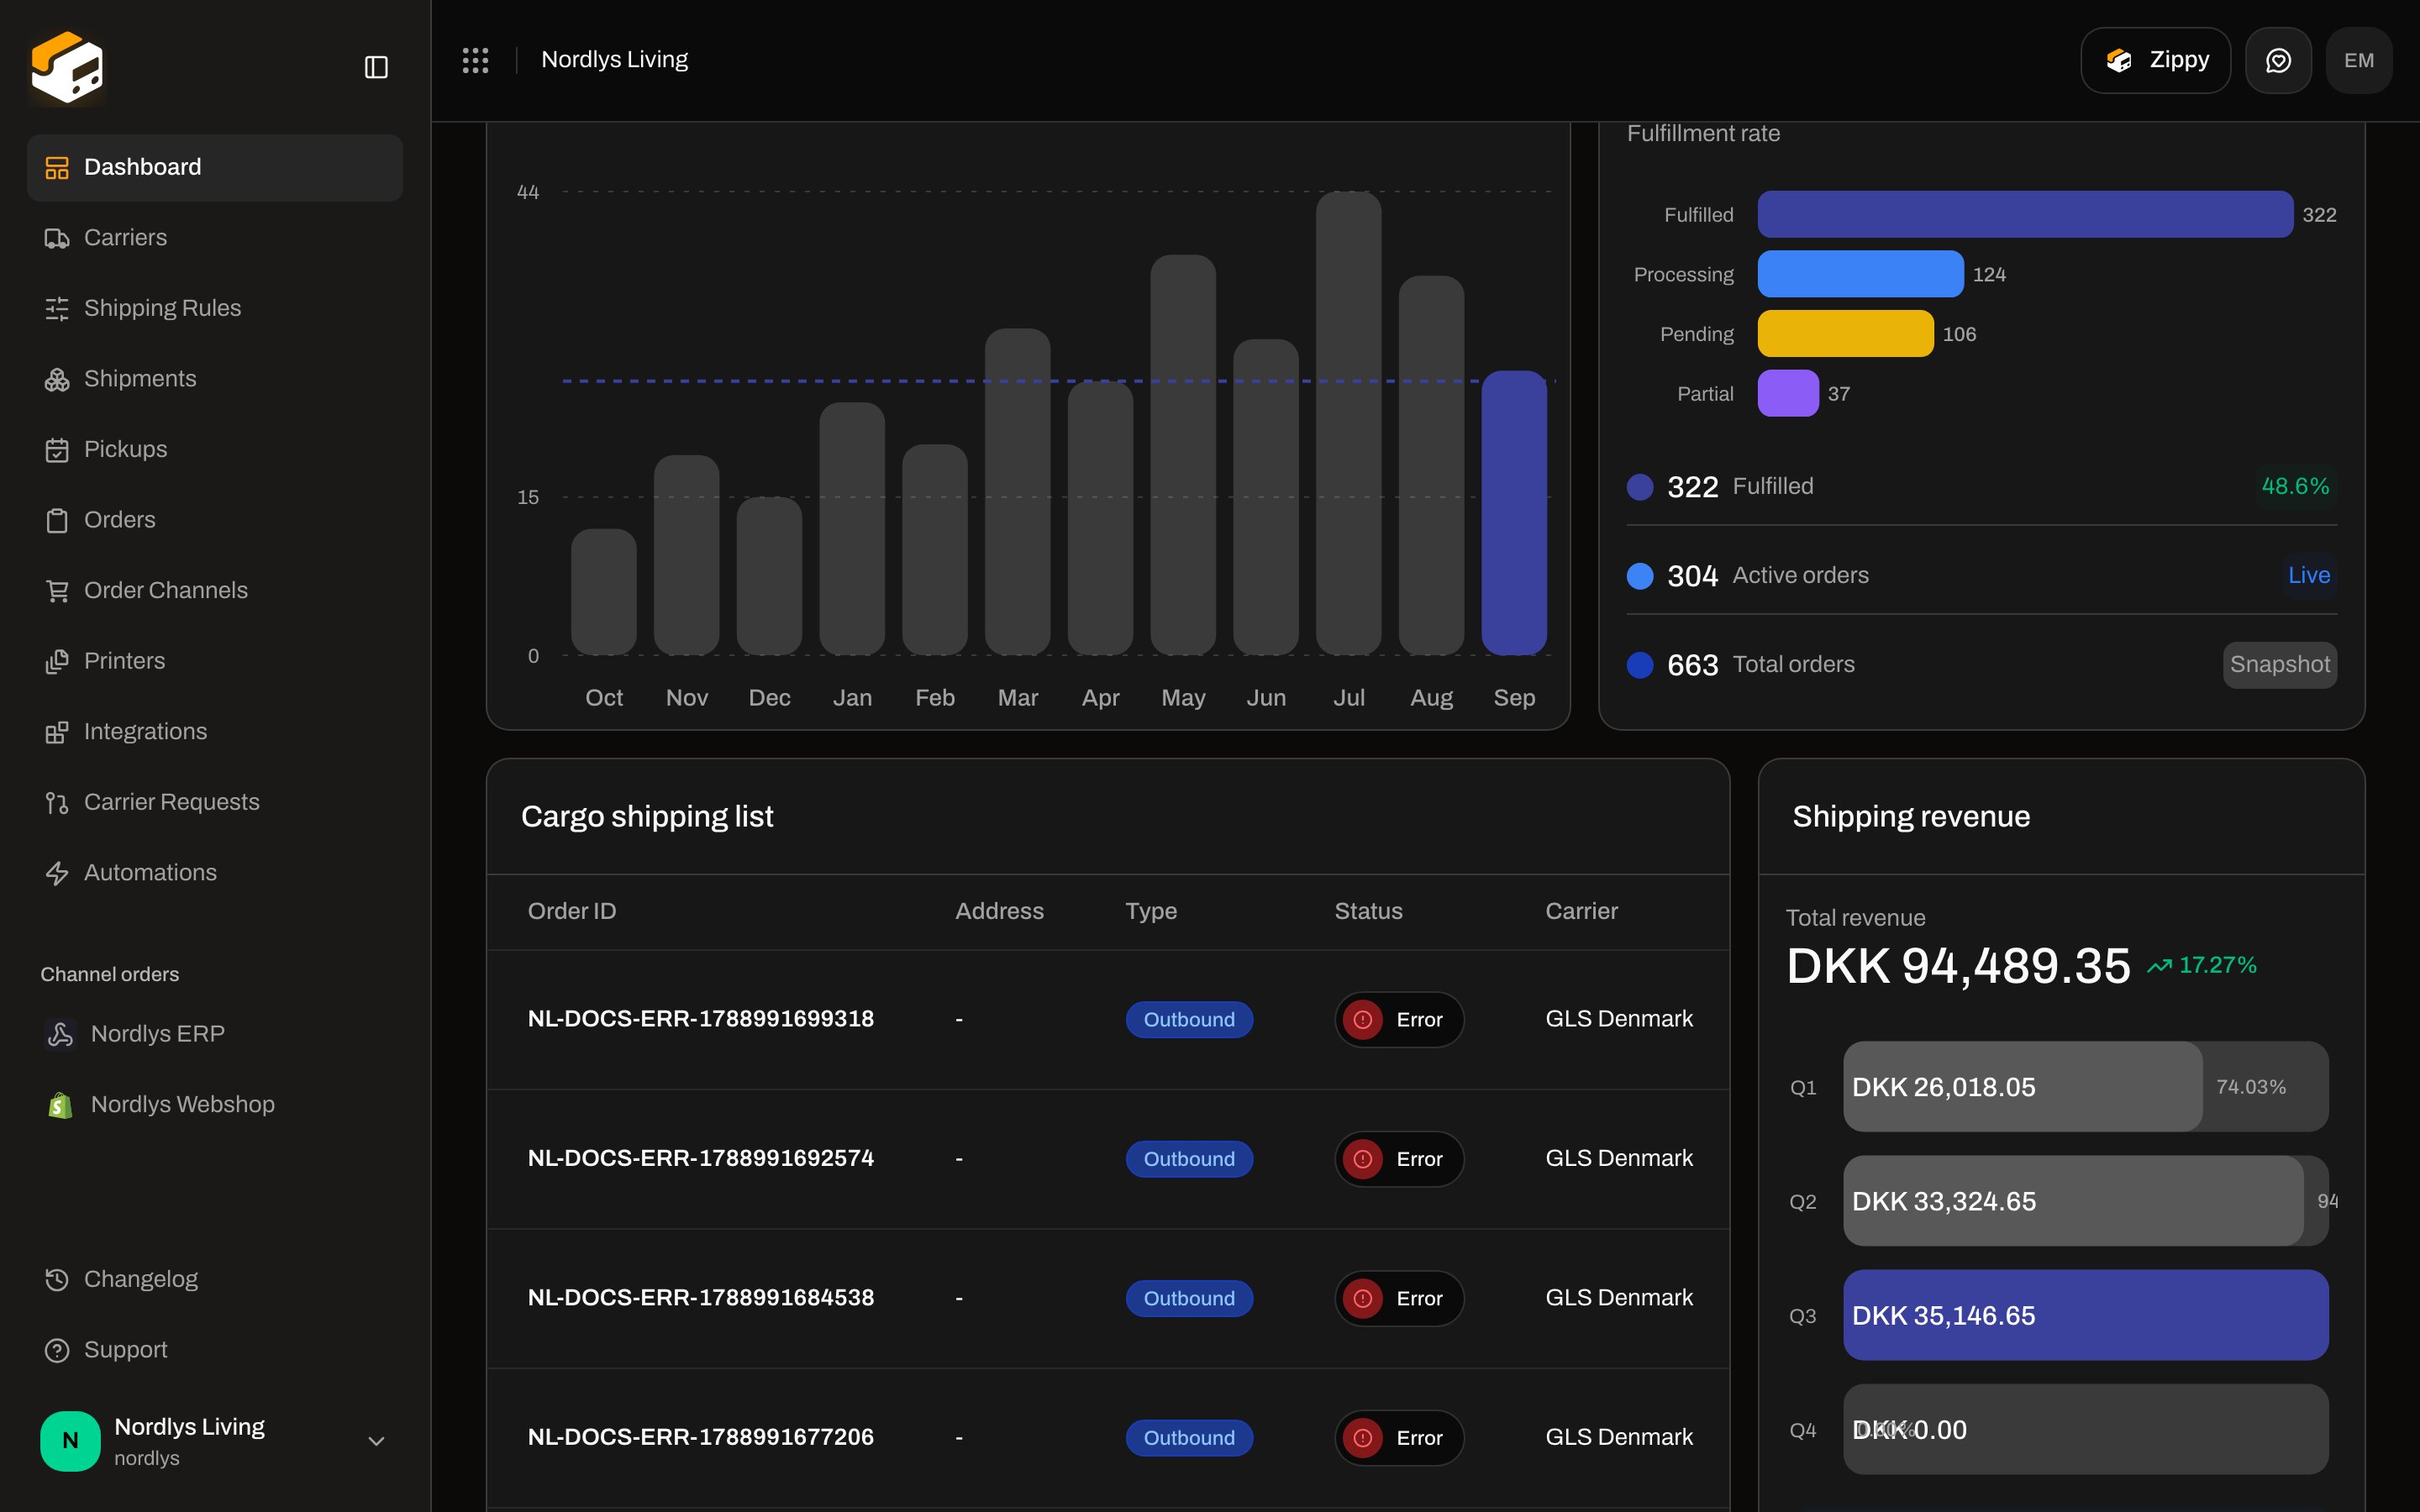 **Cargo shipping list** is the five most recent shipments, using the same columns as the shipments table (reference, address, type, status, carrier). Click a row to open that shipment.
**Shipping revenue** is the current calendar year’s booked value (dispatched and partly dispatched shipments), with a year-over-year chip when last year has data. The bars are **Q1**–**Q4**.
The dashboard does not let you pick a custom date range. Change what you see by switching organization or brand (see below), or by opening **Orders** / **Shipments** and filtering there.
## Refresh, cache, and CSV
The payload is cached for about an hour per organization and brand.
* **Updated** — relative time, with an exact timestamp on hover
* **Refresh** — bypasses the cache and recomputes. Toast: **Dashboard updated**
* **Export CSV** — downloads the numbers and lists on screen (overview, monthly shipments, quarterly revenue, orders by status, recent shipments)
Use **Refresh** after a busy booking window if the cards look stale.
## Brand scope
The dashboard follows the **active brand** in your session. Switching brand does **not** change the URL (`/{org}/dashboard` stays the same). The counts, charts, and cargo list recompute for that brand only.
Open the organization control at the bottom of the sidebar. If the organization has brands, a **Brands** section appears. **All brands** is the house-wide view.
The Nordlys workspace in these screenshots has no brands, so that section is hidden. When you do have brands, the same dashboard layout is scoped — you do not get a second set of filters on the page. Setup is in [Settings, team, and brands](/docs/tutorials/settings-team-brands) and [Brands](/docs/settings/brands). Organization switching is in [Switching organizations](/docs/getting-started/switching-organizations).
## Empty vs populated
A populated dashboard looks like the frames above: non-zero stats, a twelve-month chart, status bars, and rows in **Cargo shipping list**.
A new or unused workspace still renders the same cards. Counts stay at **0**, the charts are flat, and the cargo table is empty. That is expected until you [create a shipment](/docs/tutorials/create-a-shipment) or [sync orders](/docs/tutorials/orders).
If onboarding is still incomplete, a **Get shipping ready** card appears above the stats, with a progress ring and a button to the next setup step (sender address, carrier, or channel). Dismissing setup is covered in [Getting started](/docs/tutorials/getting-started).
If you are near your plan’s included shipments, a usage banner can appear at the top of the same page (from 80% of the monthly included volume).
The dashboard never hides cards when data is missing. Empty is zeros and blank charts, not a different layout.
## What to open next
Fulfil synced channel orders from the list and order detail.
Book a label from **Shipments** or from an order.
Send a pending shipment and print the label.
Sender address, first carrier, and the setup checklist.
Field-level: [Export dashboard CSV](/docs/how-to/dashboard-csv-export) · [Search and filters](/docs/how-to/search-and-filters) · [Ask Zippy](/docs/how-to/zippy-ai)
**Cargo shipping list** is the five most recent shipments, using the same columns as the shipments table (reference, address, type, status, carrier). Click a row to open that shipment.
**Shipping revenue** is the current calendar year’s booked value (dispatched and partly dispatched shipments), with a year-over-year chip when last year has data. The bars are **Q1**–**Q4**.
The dashboard does not let you pick a custom date range. Change what you see by switching organization or brand (see below), or by opening **Orders** / **Shipments** and filtering there.
## Refresh, cache, and CSV
The payload is cached for about an hour per organization and brand.
* **Updated** — relative time, with an exact timestamp on hover
* **Refresh** — bypasses the cache and recomputes. Toast: **Dashboard updated**
* **Export CSV** — downloads the numbers and lists on screen (overview, monthly shipments, quarterly revenue, orders by status, recent shipments)
Use **Refresh** after a busy booking window if the cards look stale.
## Brand scope
The dashboard follows the **active brand** in your session. Switching brand does **not** change the URL (`/{org}/dashboard` stays the same). The counts, charts, and cargo list recompute for that brand only.
Open the organization control at the bottom of the sidebar. If the organization has brands, a **Brands** section appears. **All brands** is the house-wide view.
The Nordlys workspace in these screenshots has no brands, so that section is hidden. When you do have brands, the same dashboard layout is scoped — you do not get a second set of filters on the page. Setup is in [Settings, team, and brands](/docs/tutorials/settings-team-brands) and [Brands](/docs/settings/brands). Organization switching is in [Switching organizations](/docs/getting-started/switching-organizations).
## Empty vs populated
A populated dashboard looks like the frames above: non-zero stats, a twelve-month chart, status bars, and rows in **Cargo shipping list**.
A new or unused workspace still renders the same cards. Counts stay at **0**, the charts are flat, and the cargo table is empty. That is expected until you [create a shipment](/docs/tutorials/create-a-shipment) or [sync orders](/docs/tutorials/orders).
If onboarding is still incomplete, a **Get shipping ready** card appears above the stats, with a progress ring and a button to the next setup step (sender address, carrier, or channel). Dismissing setup is covered in [Getting started](/docs/tutorials/getting-started).
If you are near your plan’s included shipments, a usage banner can appear at the top of the same page (from 80% of the monthly included volume).
The dashboard never hides cards when data is missing. Empty is zeros and blank charts, not a different layout.
## What to open next
Fulfil synced channel orders from the list and order detail.
Book a label from **Shipments** or from an order.
Send a pending shipment and print the label.
Sender address, first carrier, and the setup checklist.
Field-level: [Export dashboard CSV](/docs/how-to/dashboard-csv-export) · [Search and filters](/docs/how-to/search-and-filters) · [Ask Zippy](/docs/how-to/zippy-ai)